

Credit: Chris Howard
This article was produced by the Ministry of Business, Innovation and Employment (MBIE). The content you find below is exclusive to the Tourism Evidence and Insights Centre.
The commentary below presents the national context for tourism in the year ending December 2018 (and for the December 2018 quarter where available). The main tourism measures are showing positive growth across the New Zealand tourism industry, supported by the continued increase in holidaymakers, growth in visitors from the wider Asia region, as well as relatively favourable exchange rates. Key findings are below:
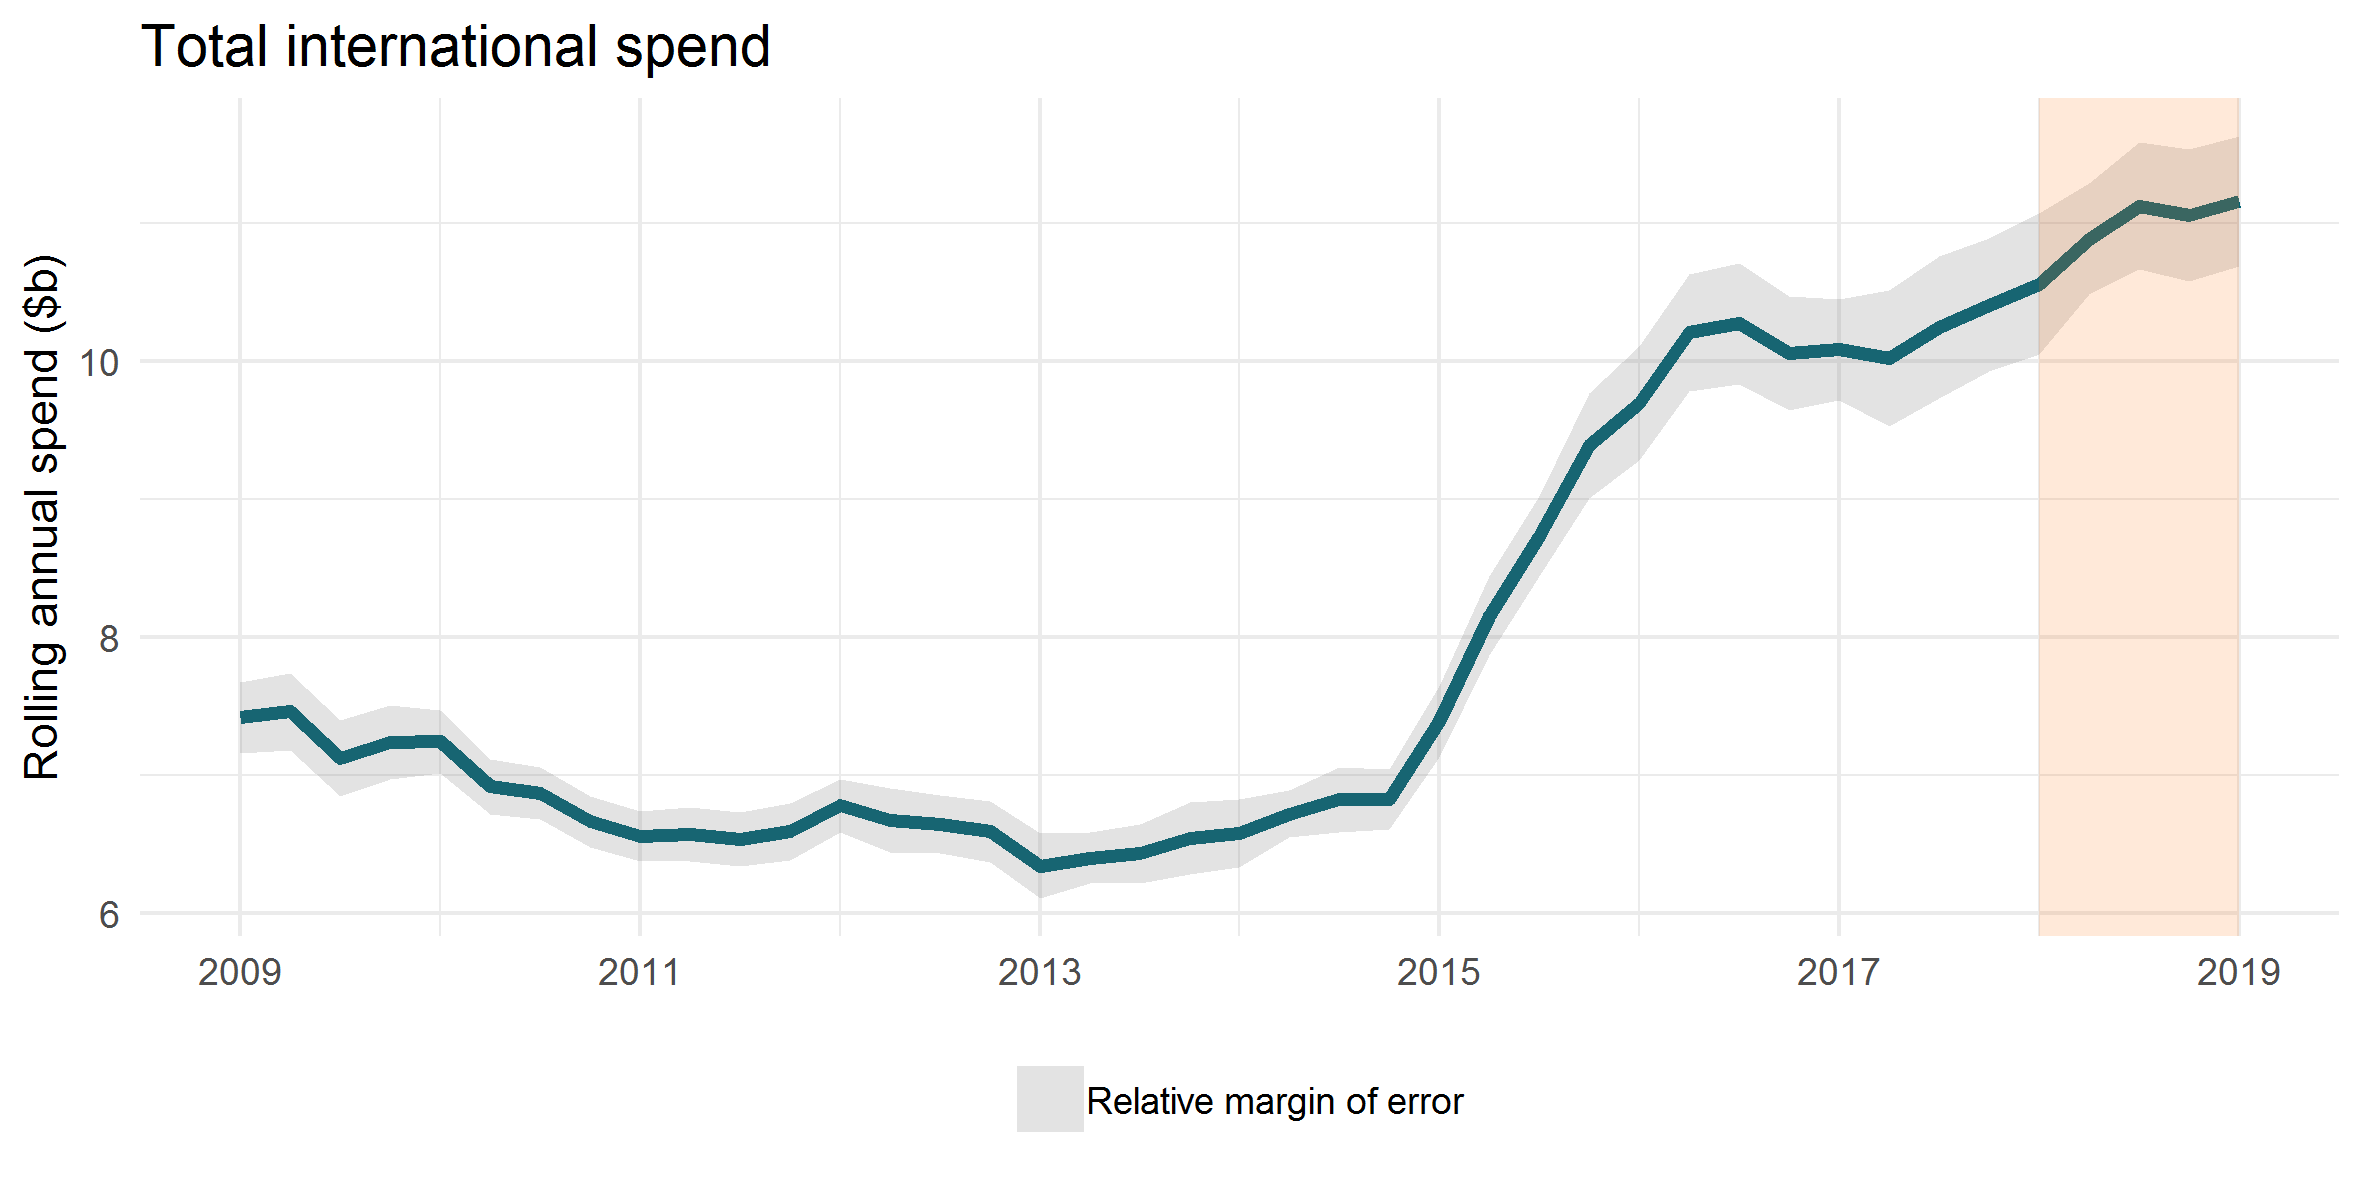
Spending by international visitors in New Zealand grew six per cent to $11.2 billion for the year ending December 2018. This equated to an overall increase of $599 million over the year (although the growth was not statistically significant).
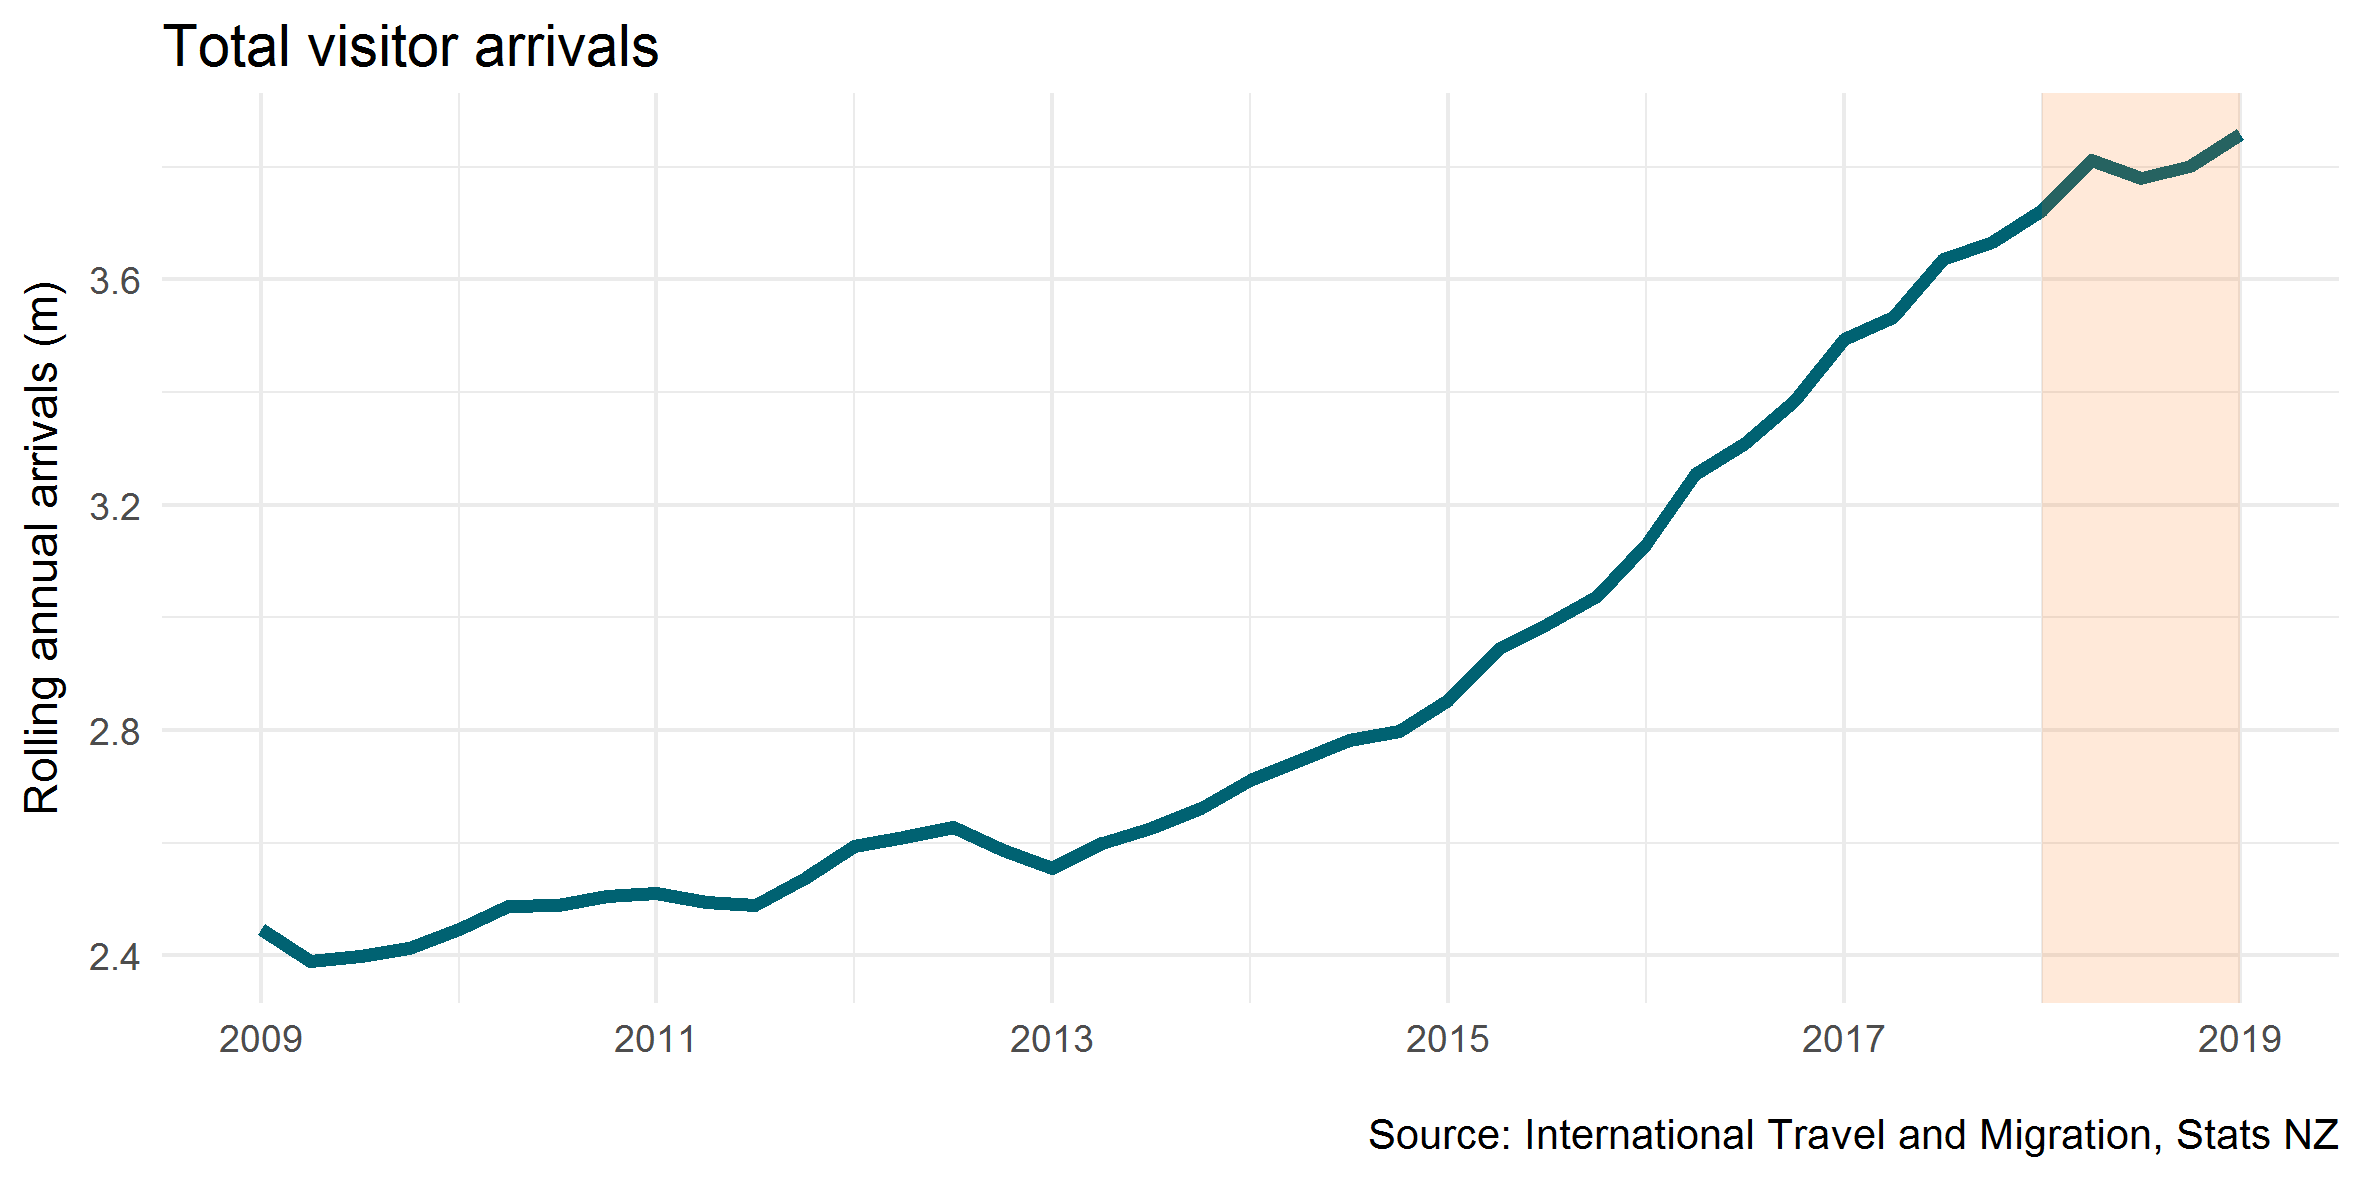
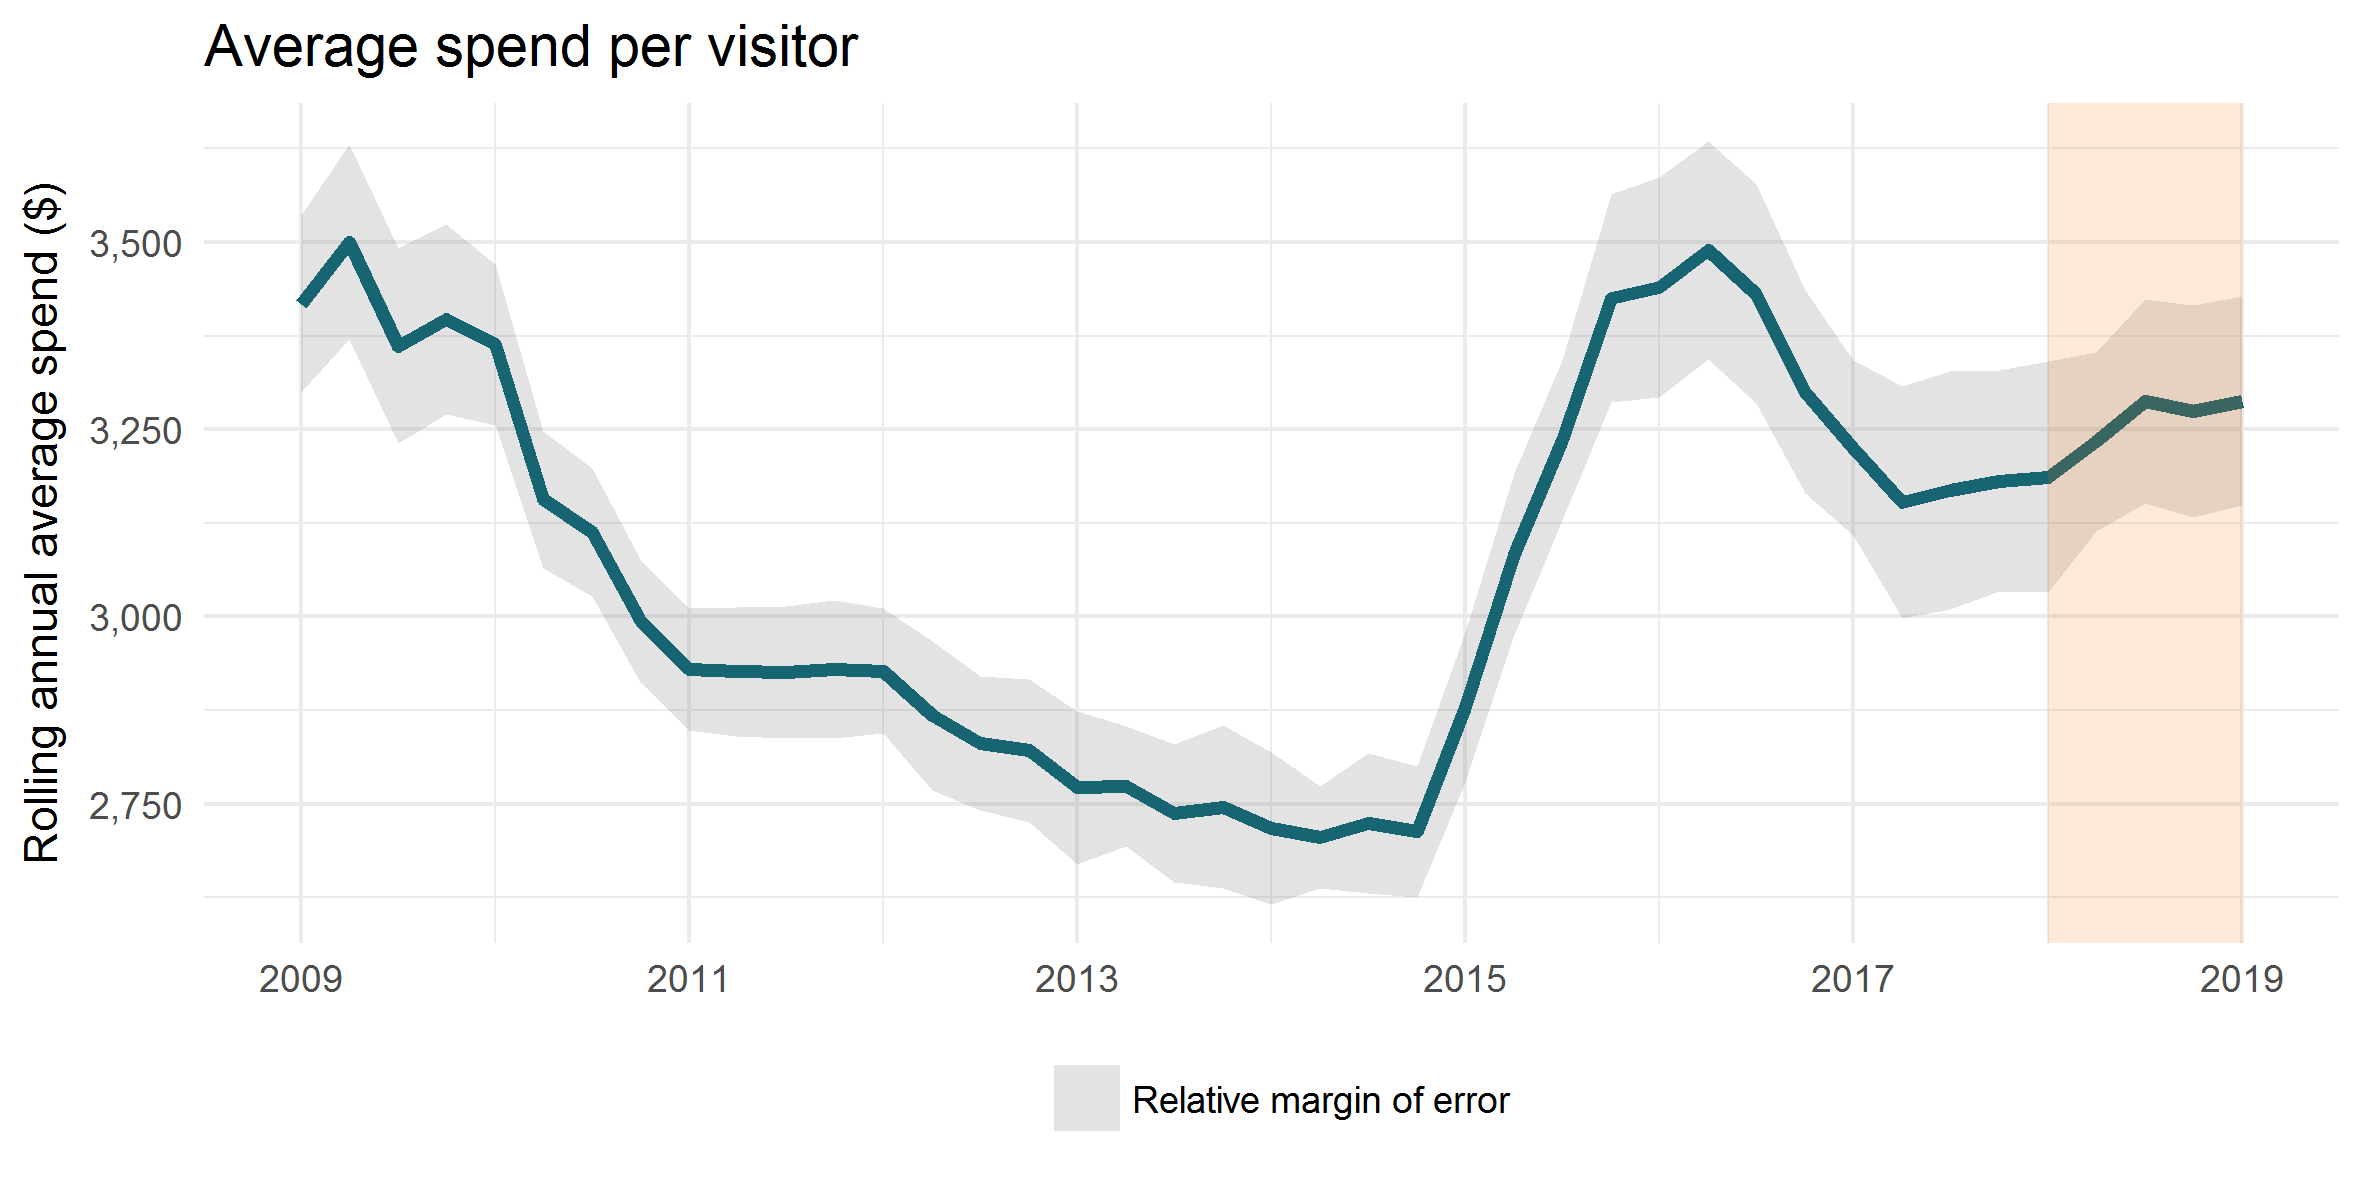
Over the same period, the number of international visitors increased by three per cent. Spend grew faster than visitor numbers, leading to an increase of three per cent for average spend per visitor. Average international visitor spend over the year was $3,300 per visitor.
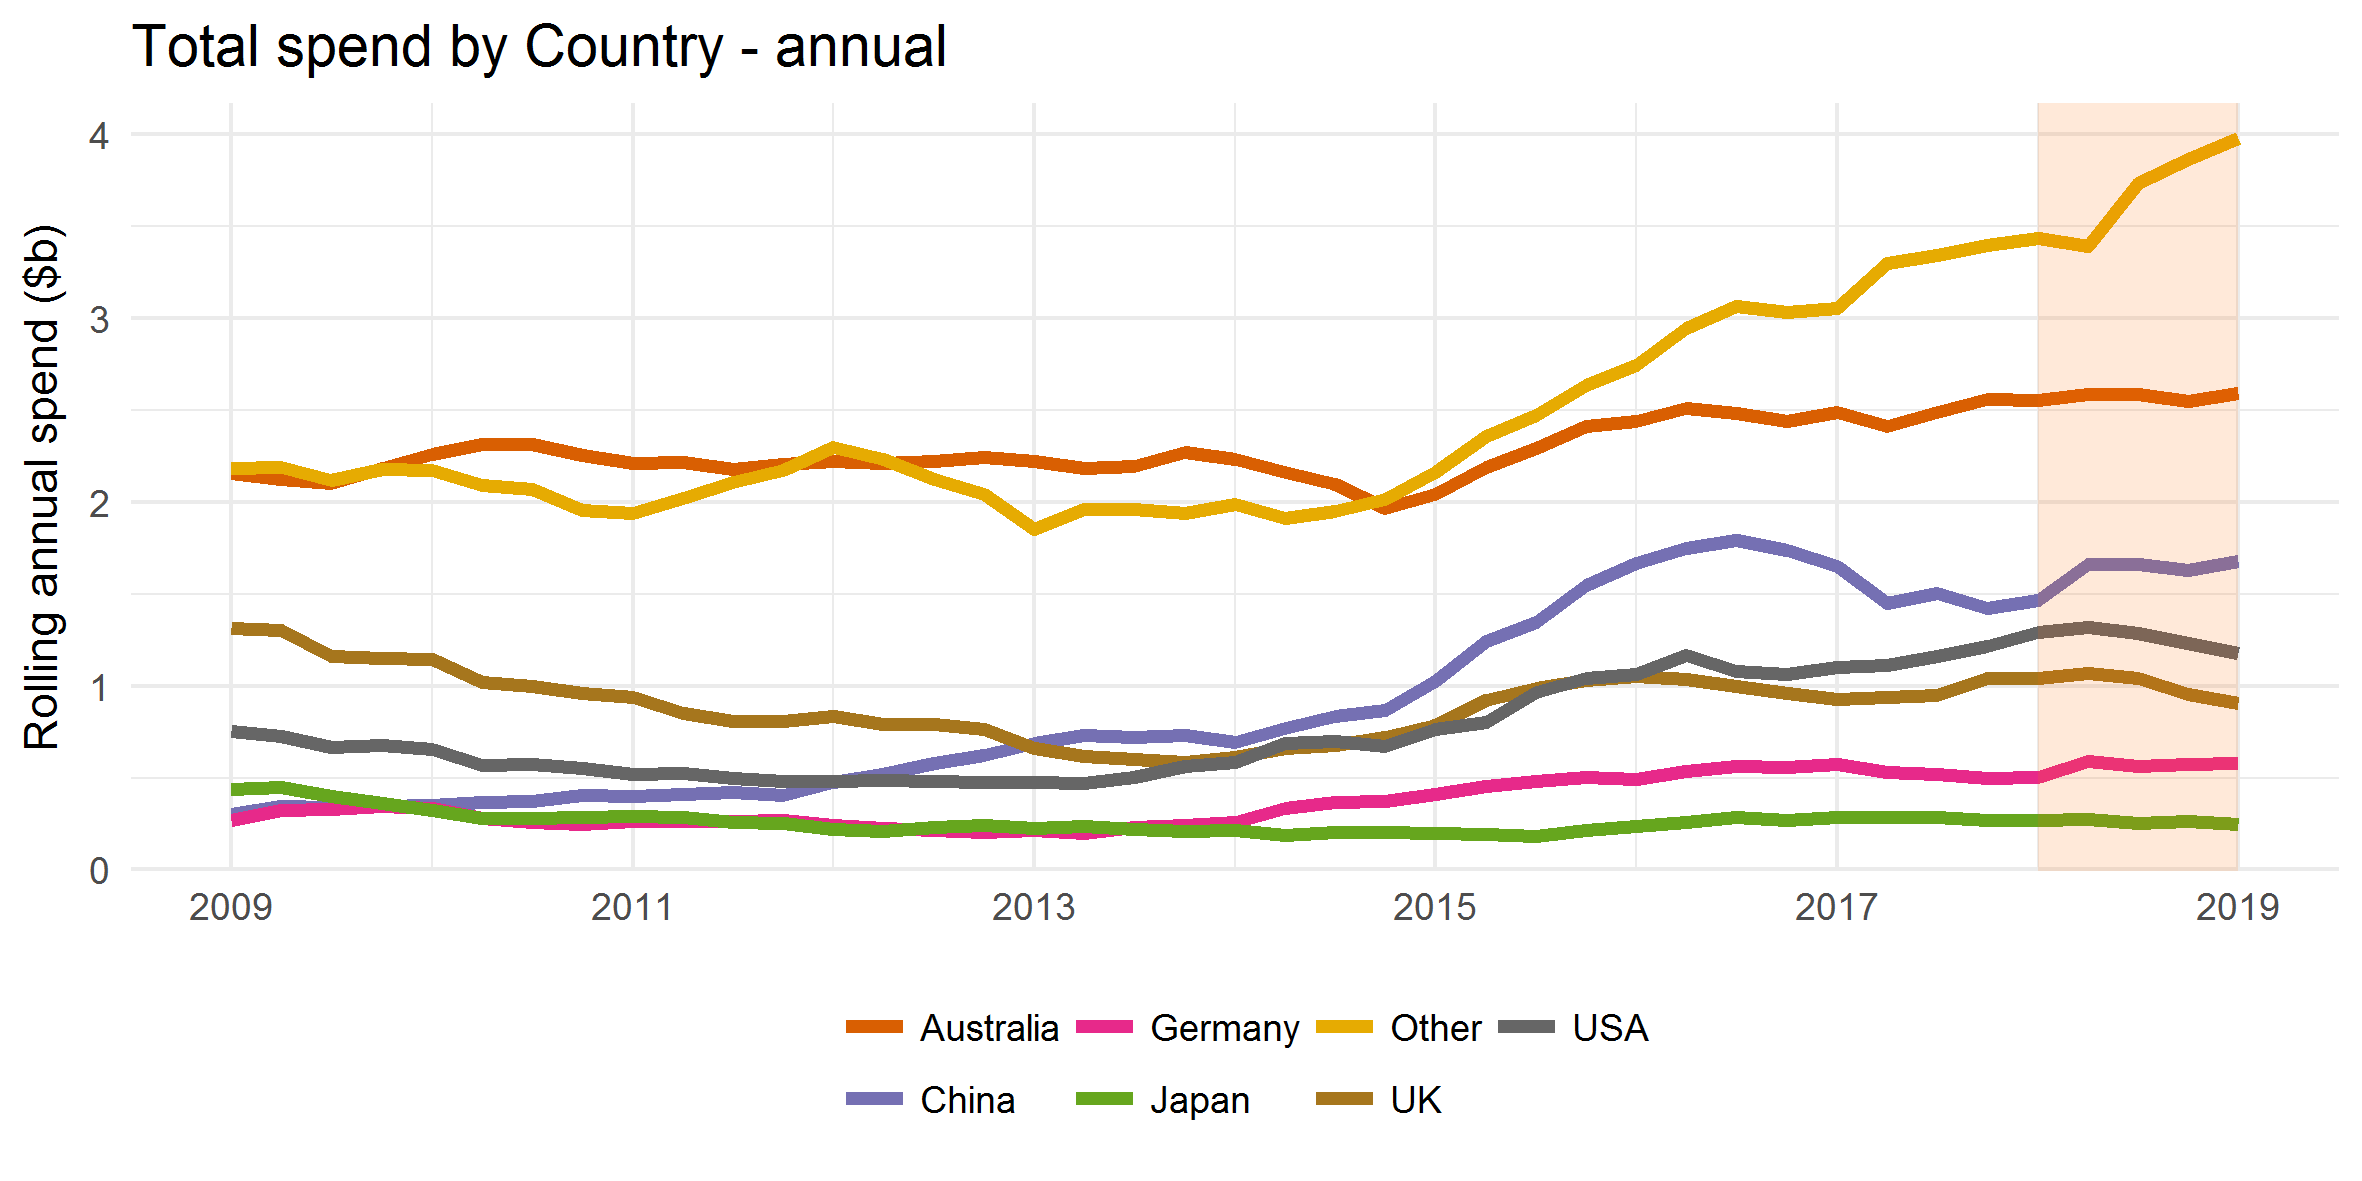
Much of the growth in overall international visitor expenditure over the last year has been driven by “other” countries (i.e. not the largest six markets of Australia, China, US, UK, Japan and Germany). These countries are responsible for a large proportion of the increase in growth in expenditure, with visitor spending from these countries growing by 15.9 per cent over 2018.
While the International Visitor Survey cannot provide an accurate breakdown of “other” countries, visitor arrivals data suggests that much of that visitor growth is from “Other Asia” countries (Asia excluding China and Japan). The following graph shows visitor numbers for selected Asian markets over the last year.
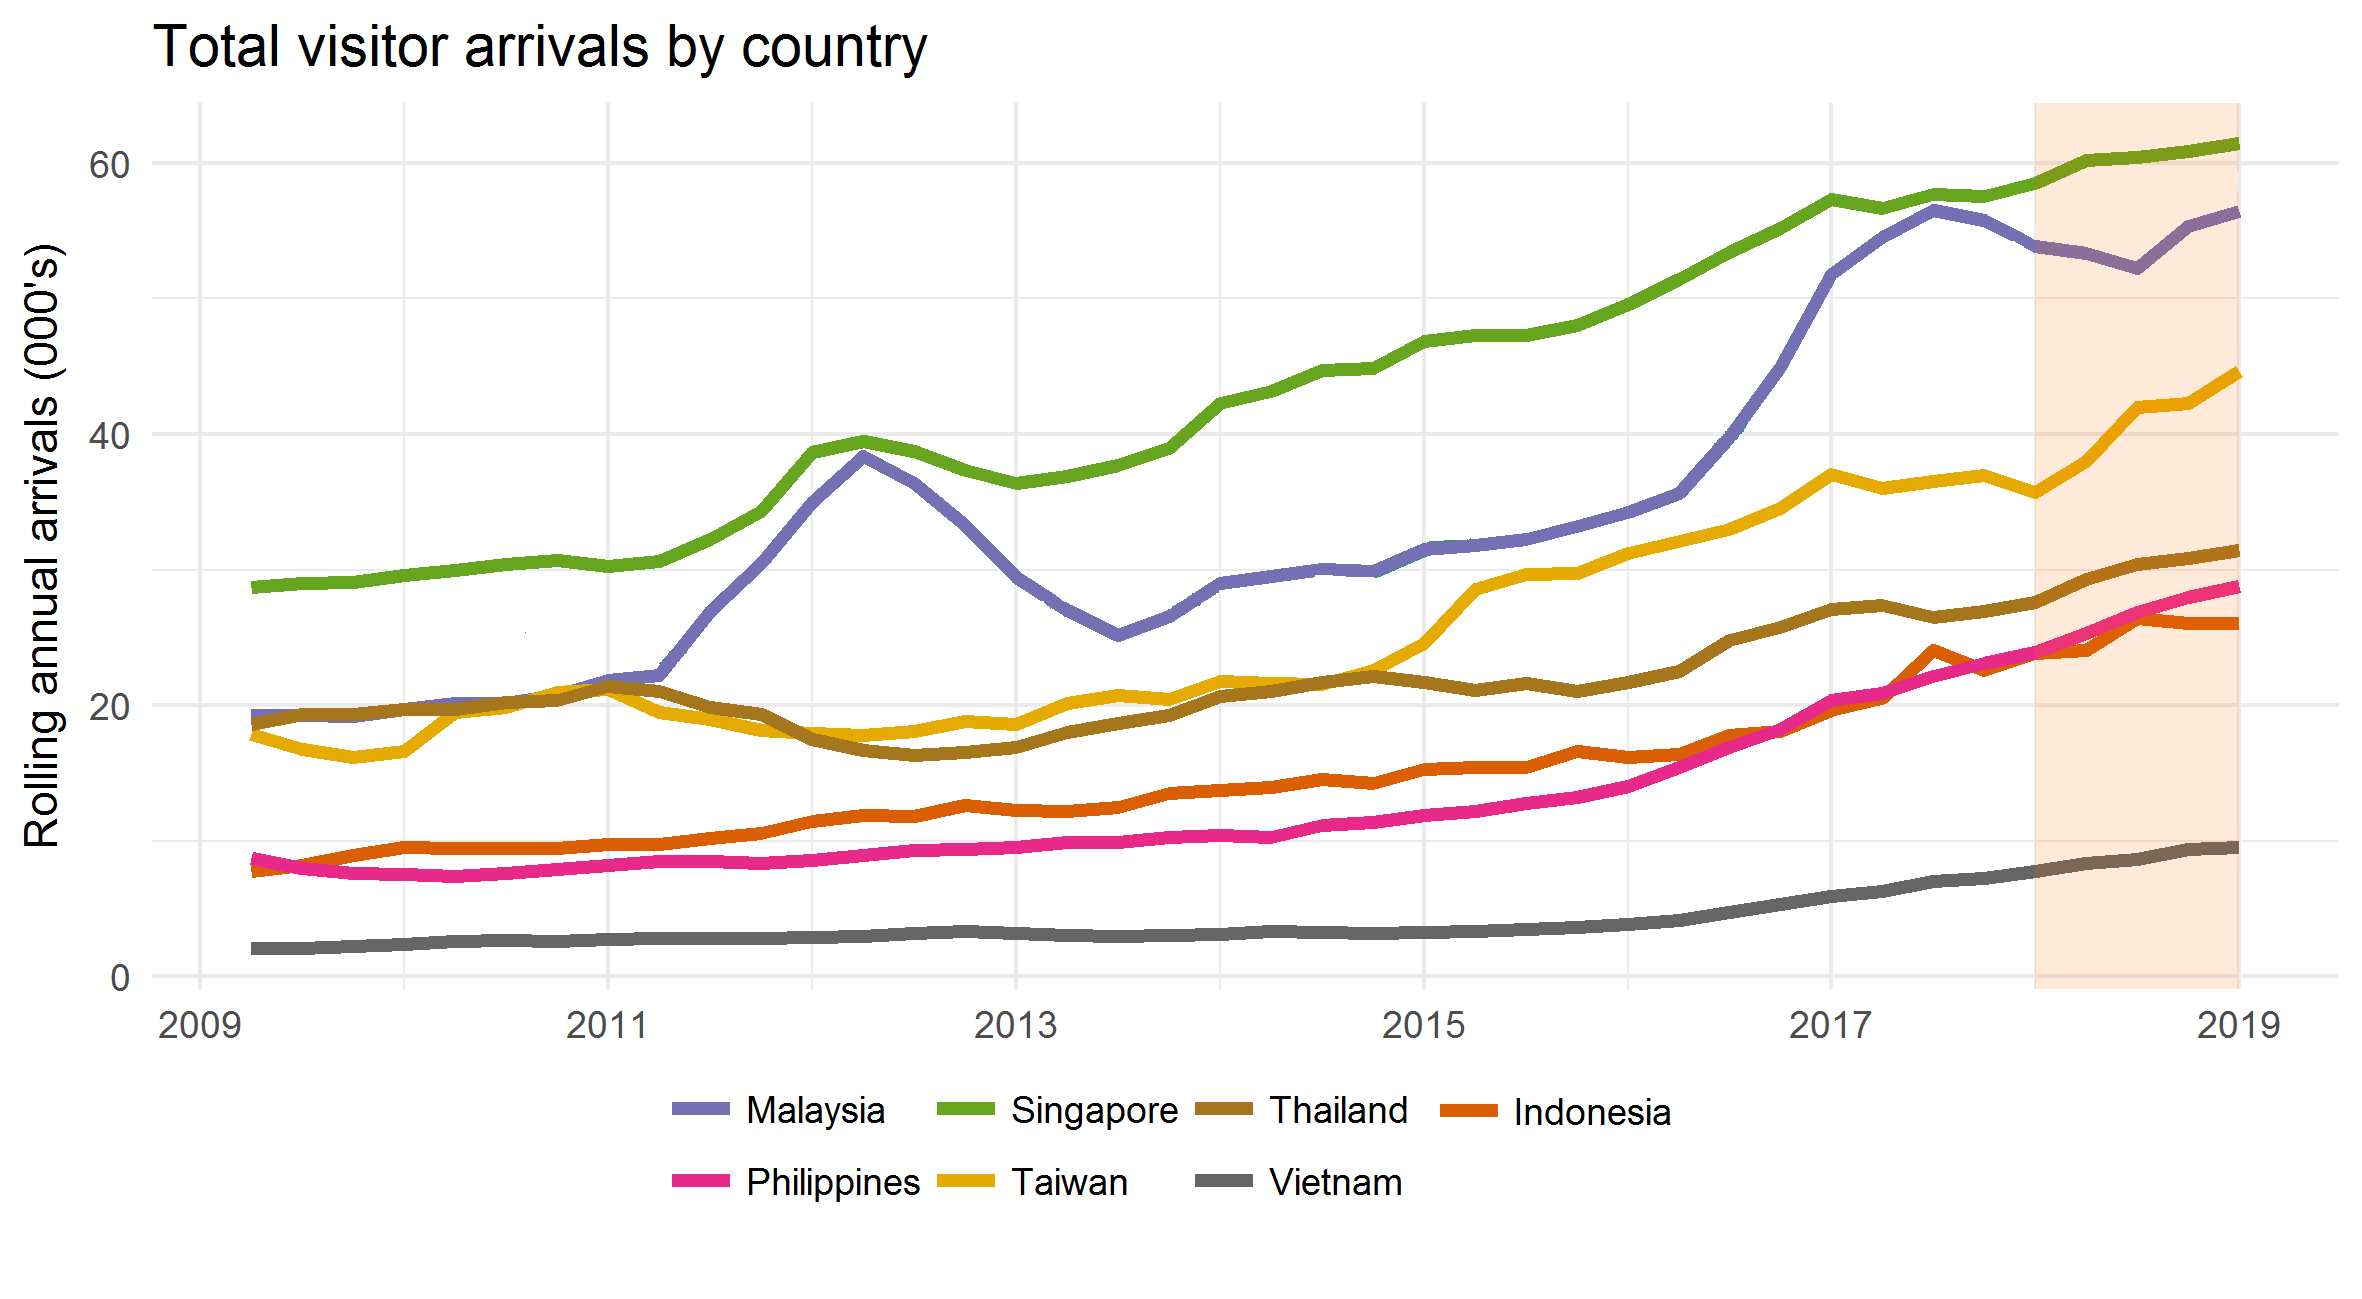
As air capacity increases to places such as China, there is a flow-on effect on nearby countries. The Philippines increased 20.4 per cent over the year to 28,800 visitors; Thailand grew 13.9 per cent to 31,400 visitors; and Vietnam increased 22.4 per cent to 9,500 visitors.
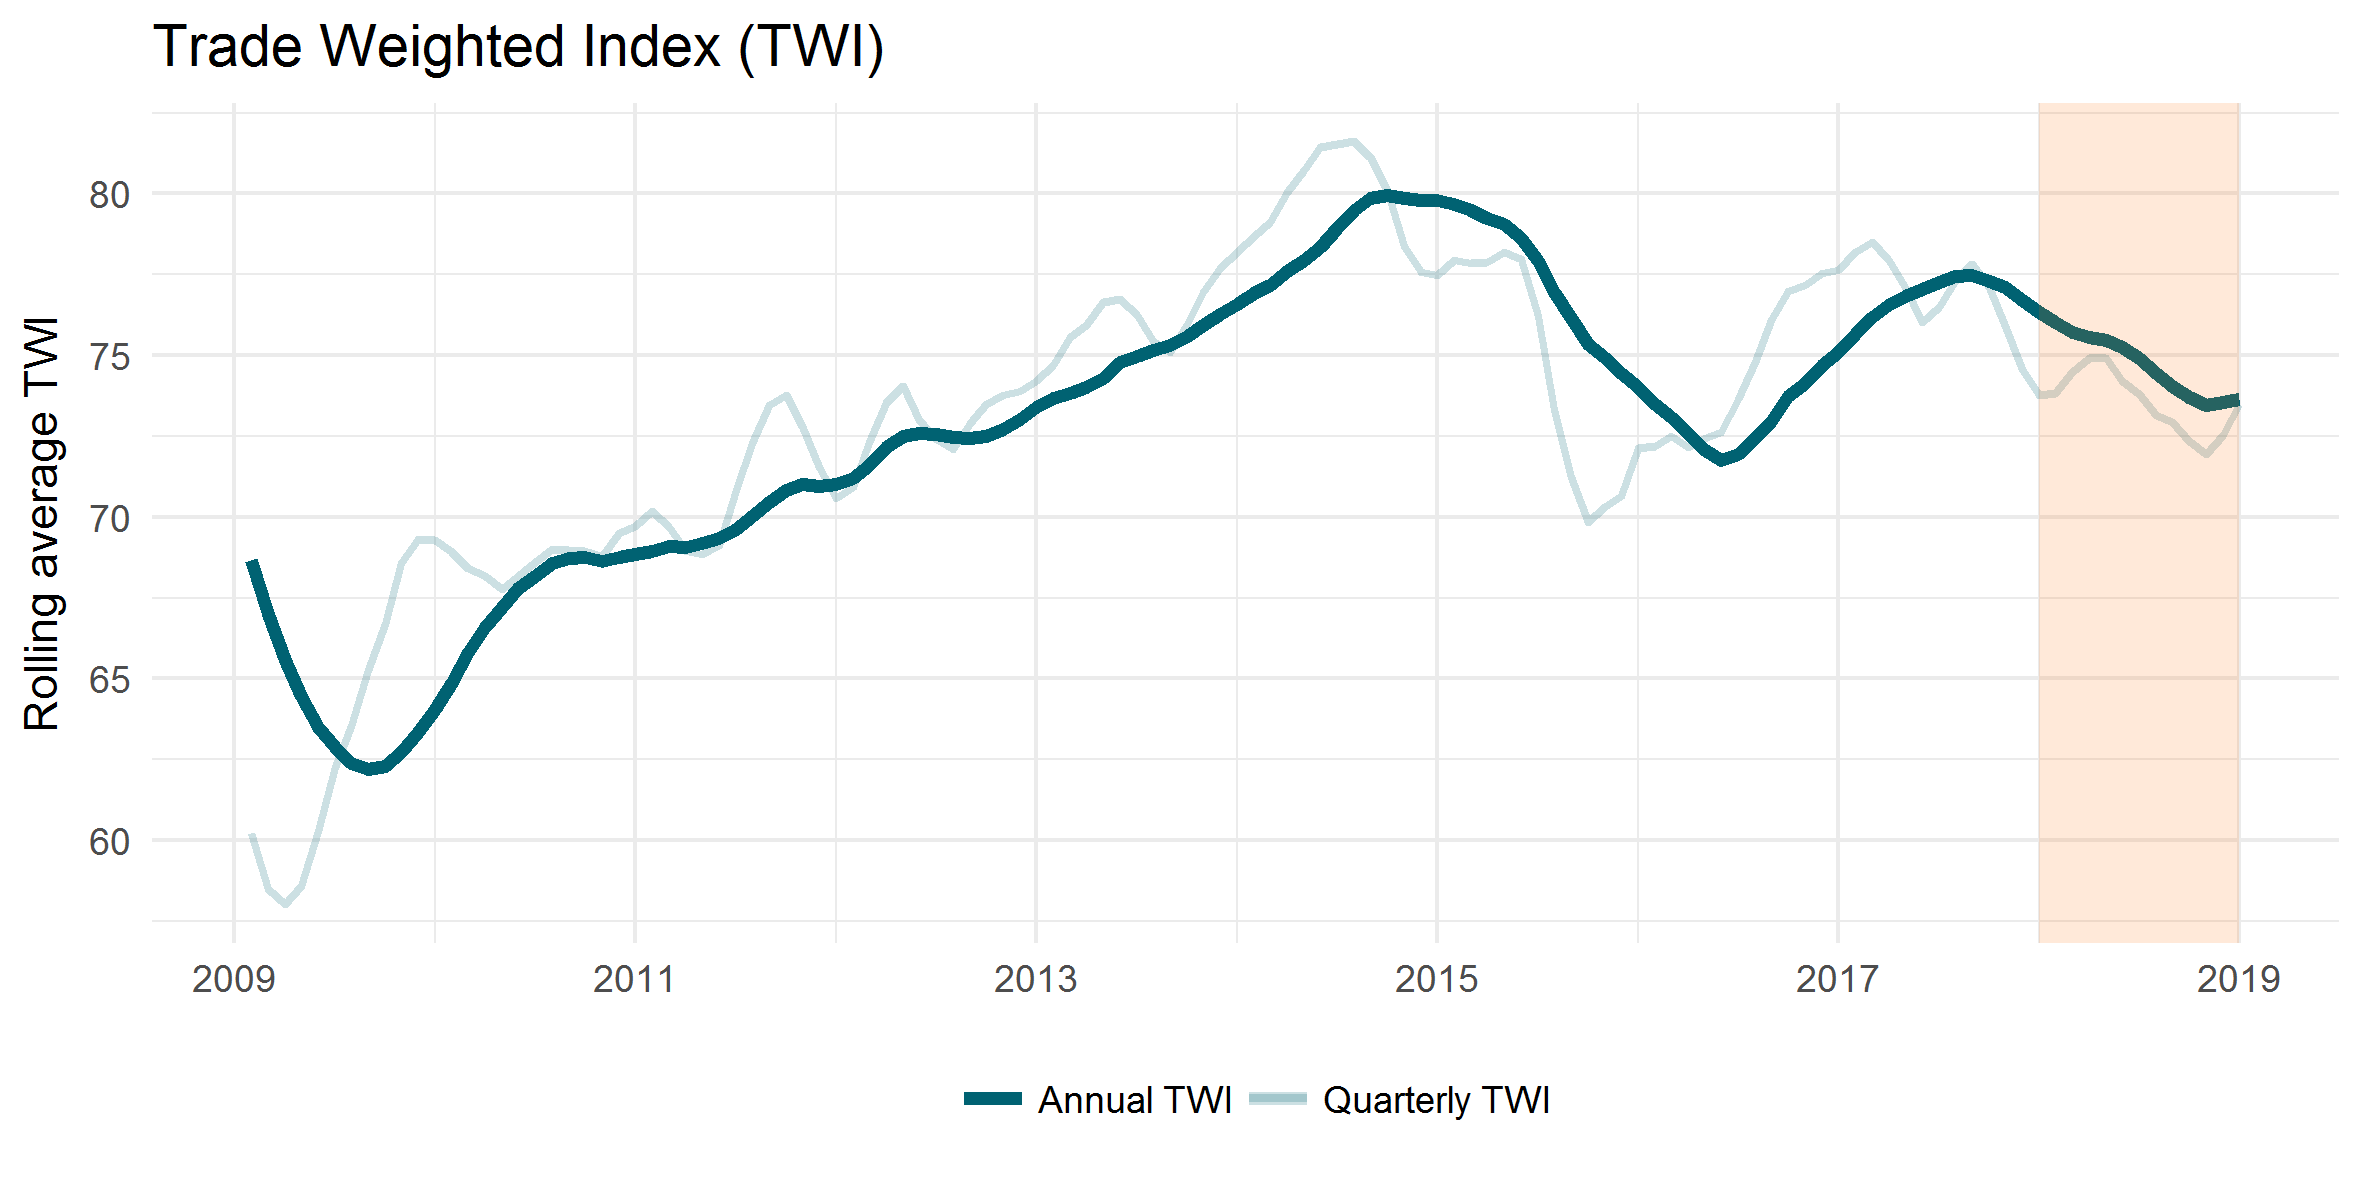
The fall in exchange rates over 2018 is a main driver of the overall growth in international visitor spend. The New Zealand dollar fell against many of our major tourism markets over the year, which increased the purchasing power of visitors, allowing them to spend more in New Zealand dollars for the same amount of their home currency. Exchange rates have since risen, but overall remain relatively favourable.
The following graph shows that the Trade Weighted Index (TWI). The TWI is an index showing the value of the New Zealand dollar in relation to our major trading partners.
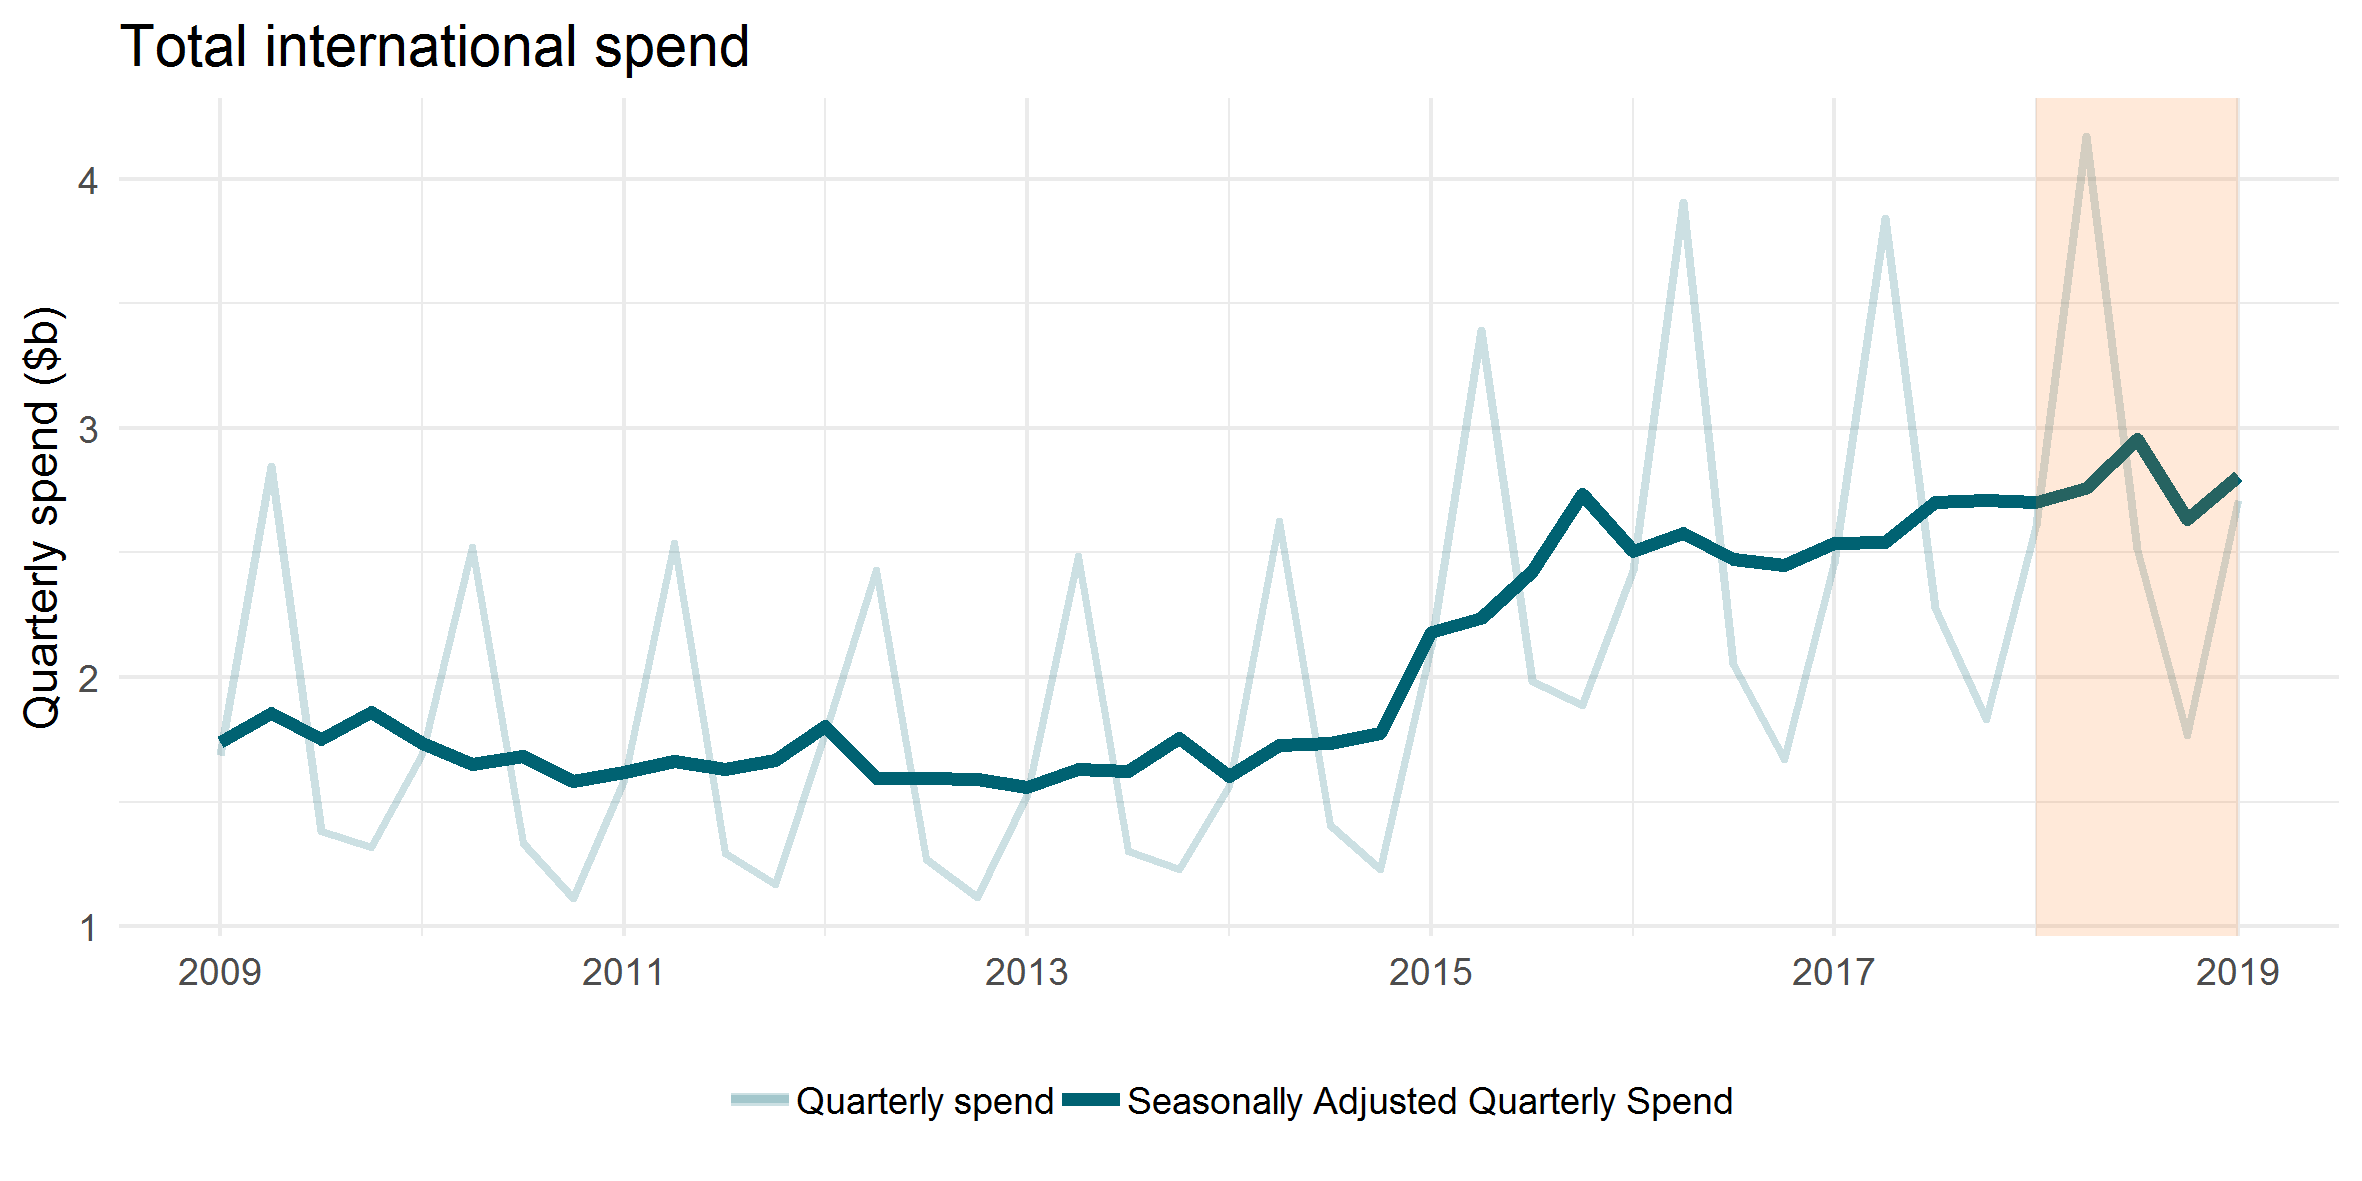
After adjusting for seasonal impacts, there was a rise in total international visitor spending of around six per cent for the December 2018 quarter, up from the drop off last quarter. This rise shows that spend in the December quarter was higher than might have been expected given usual seasonal patterns.
From the year ended December 2017 to the year ended December 2018, the number of visitors to New Zealand grew by 134,000. Of these visitors, half (or 68,000) were holidaymakers, while 17 per cent (or 33,600) were visiting friends or relatives. This implies that there was the growth in approximately 44,000 visitors for other travel purposes, such as education and working holiday visas.
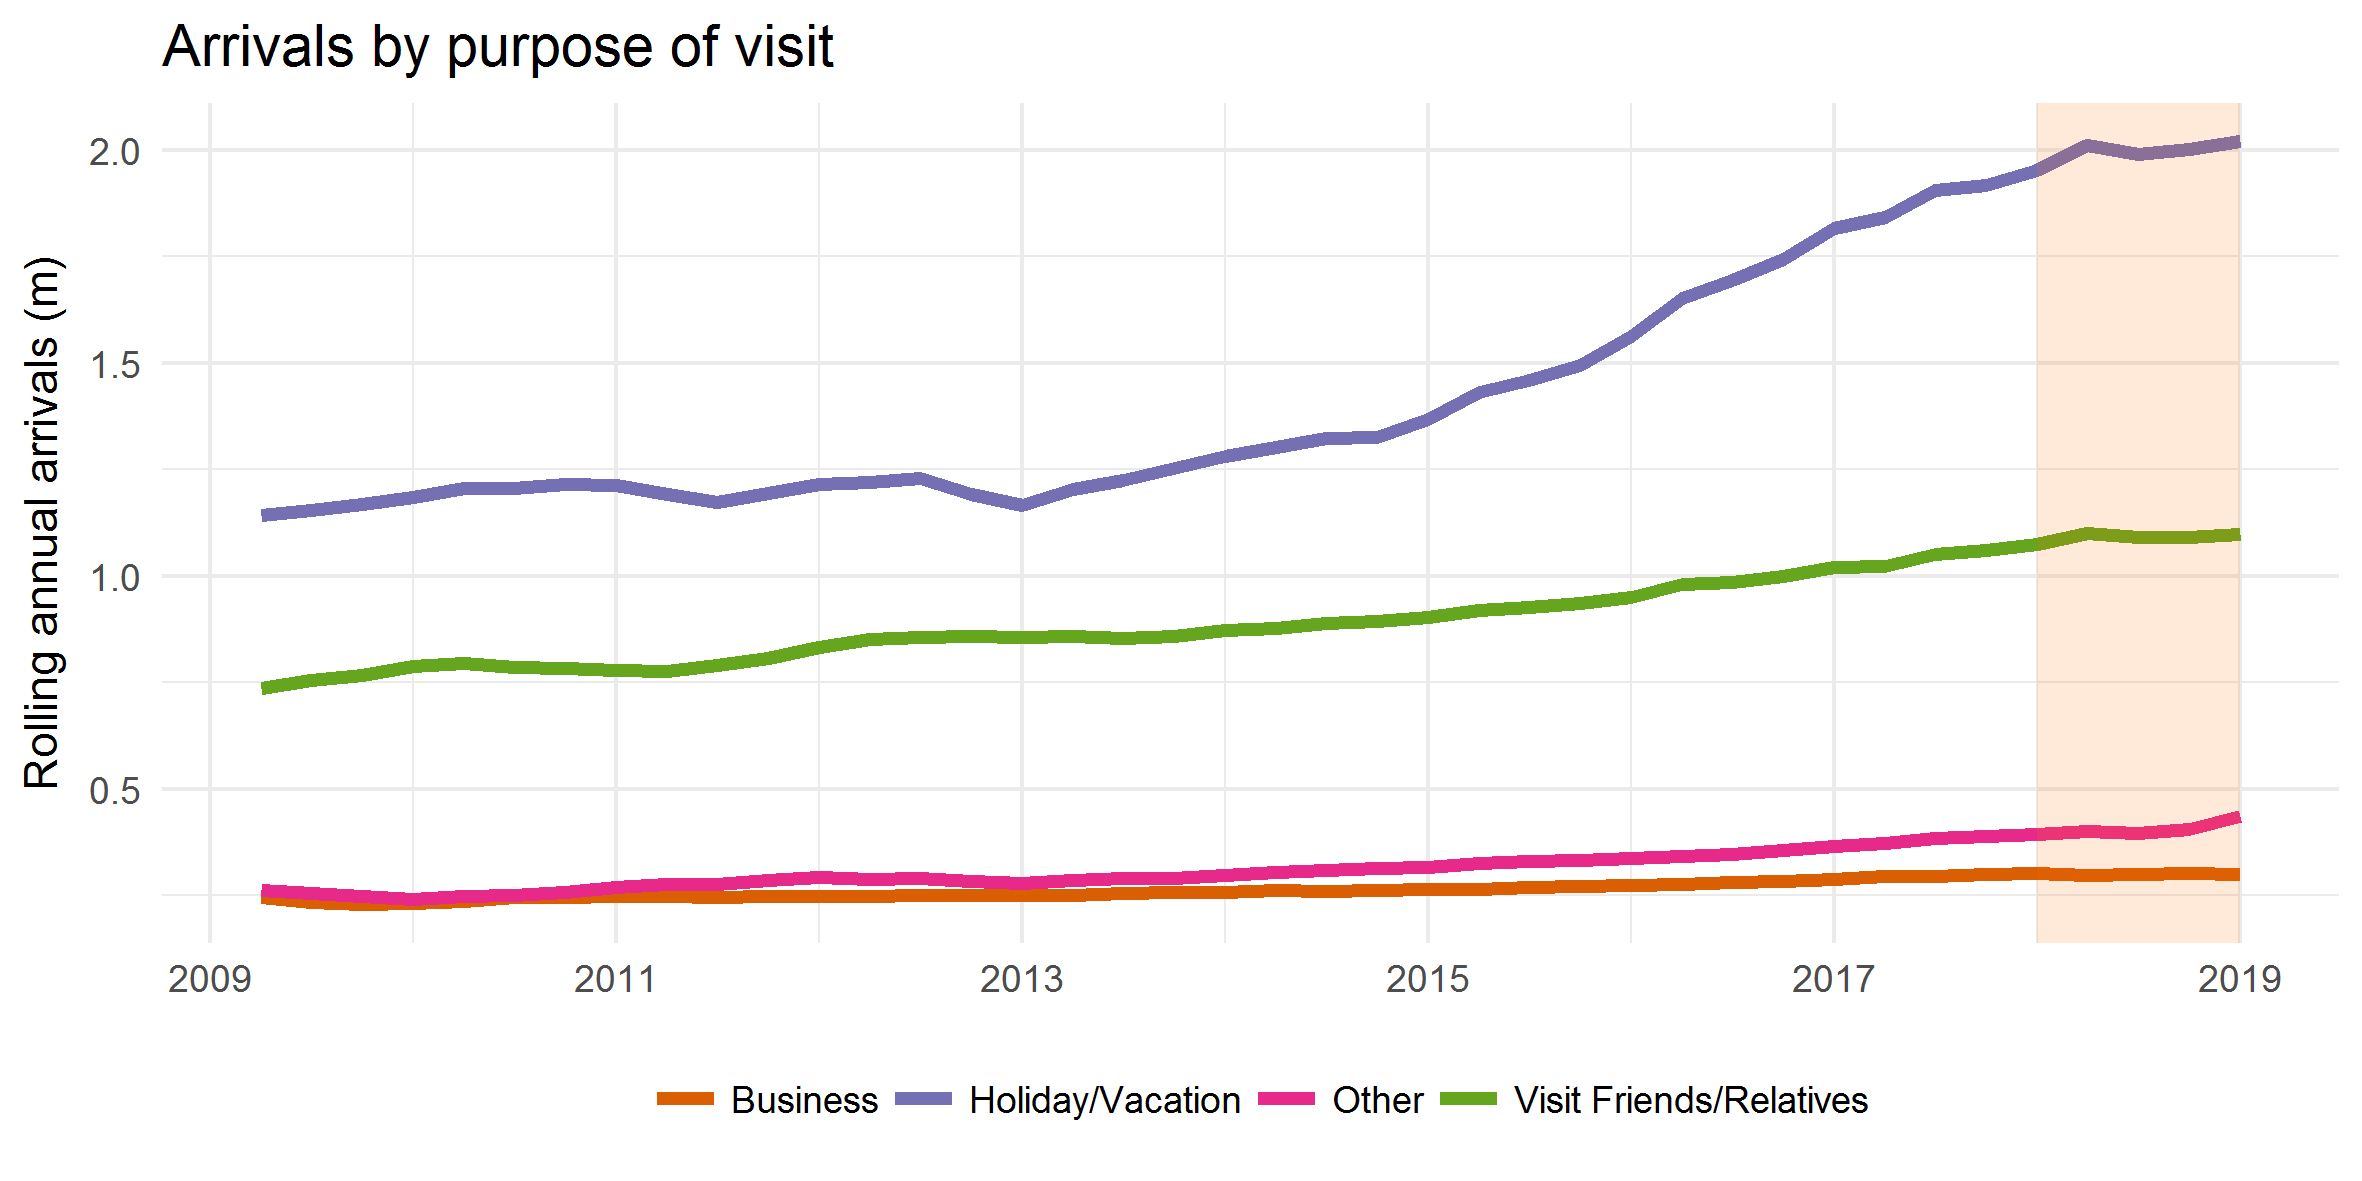
Holidaymakers to New Zealand made up around 52 per cent of all international arrivals in the year ended December 2018, yet made up approximately 64 per cent of all spending. In contrast, people visiting friends and relatives made up 29 per cent of all arrivals, yet made up just 20 per cent of all spend.
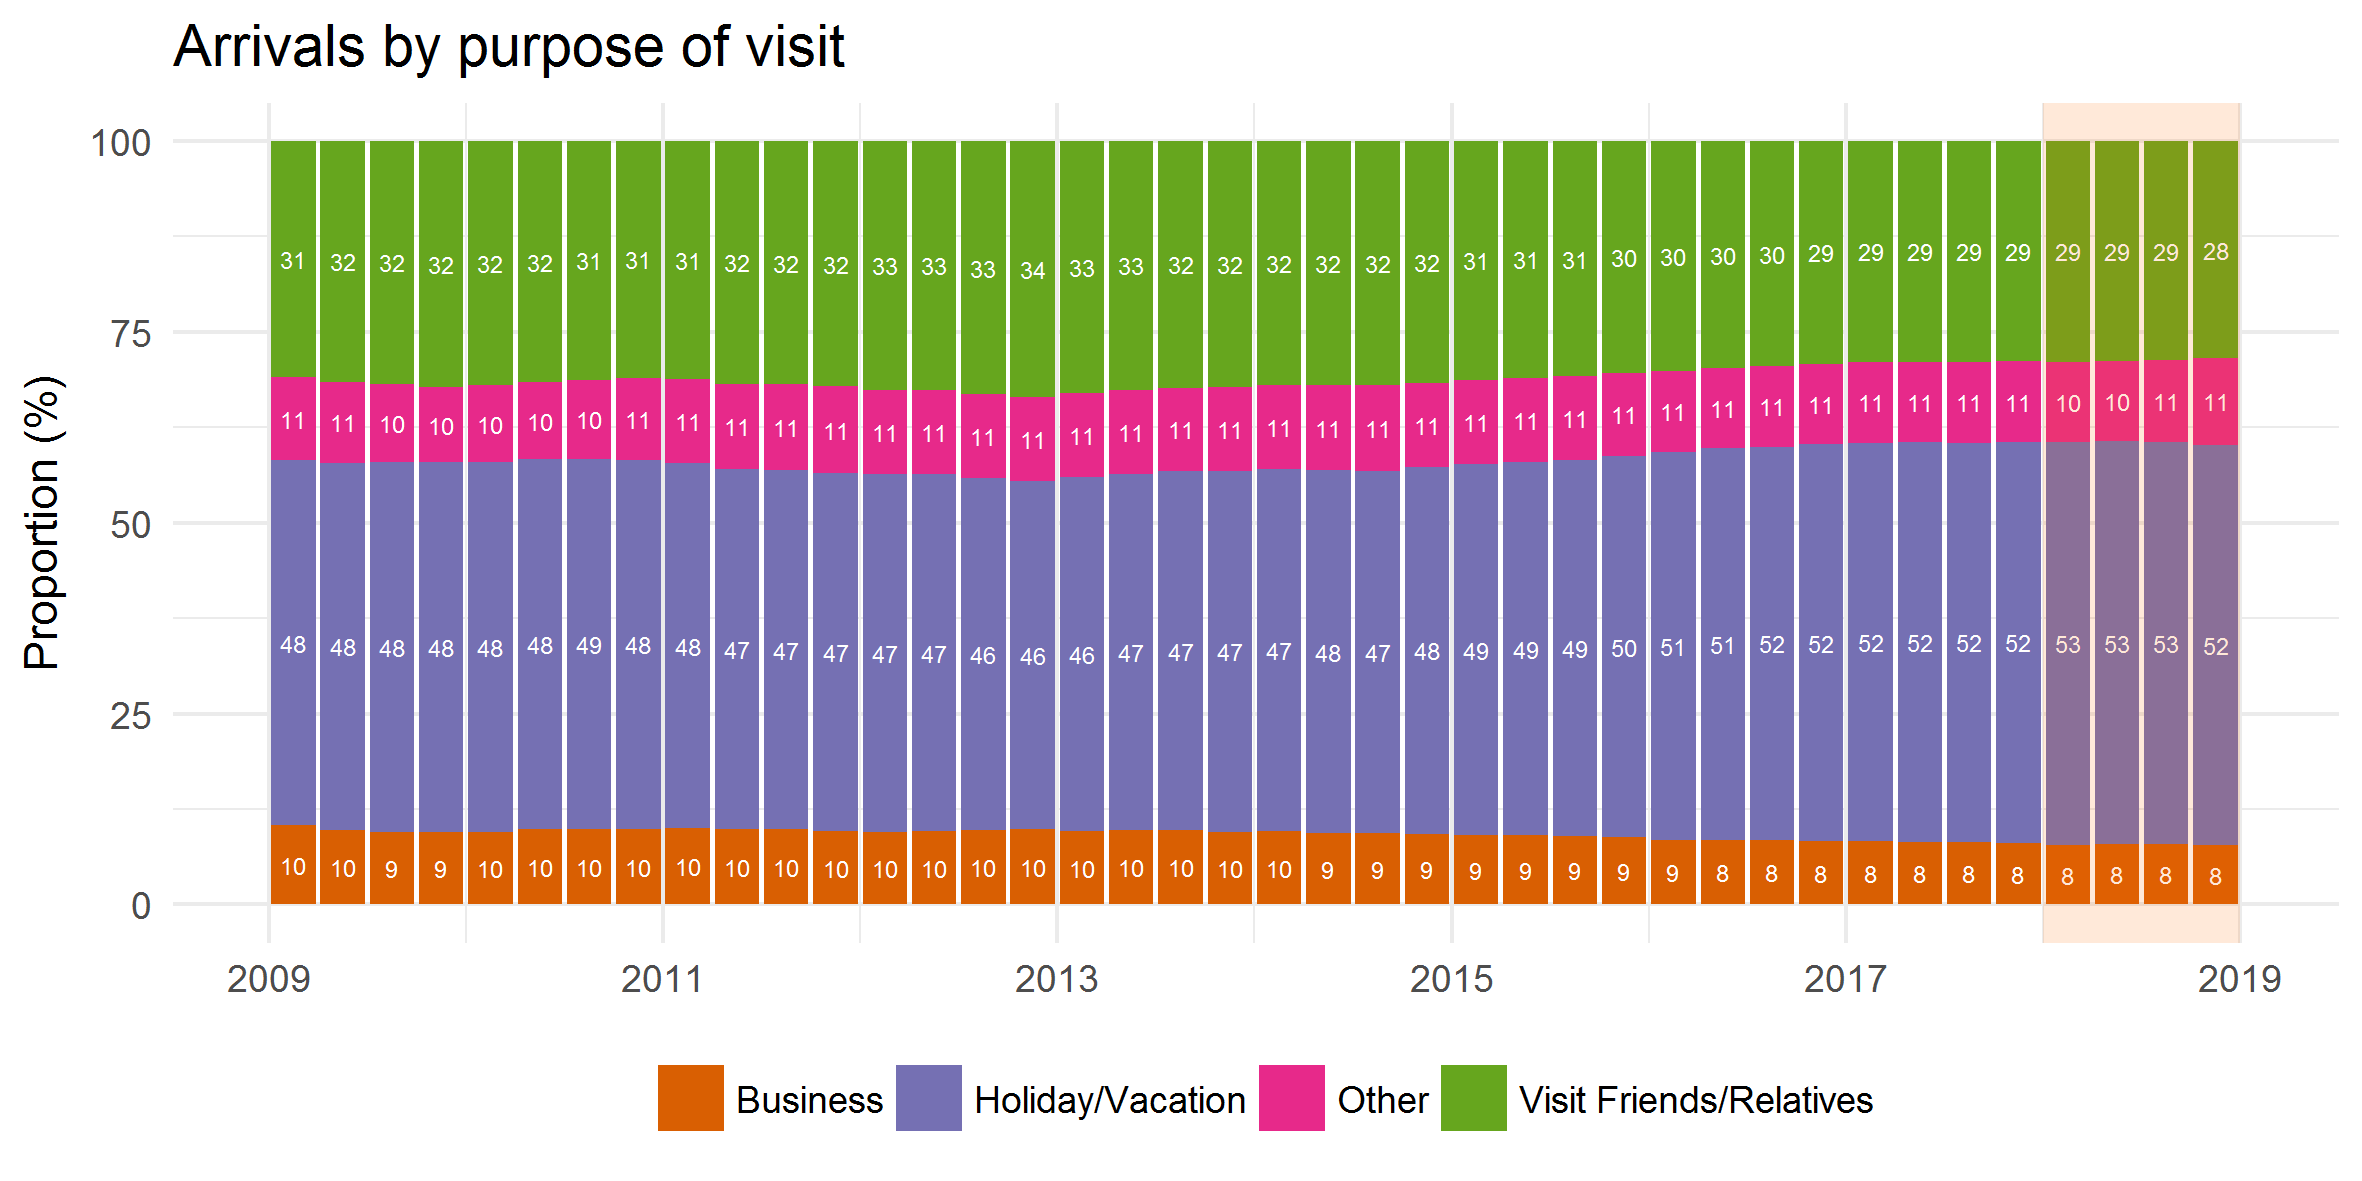
Holidaymakers spent on average $3,900 per person in the year ended December 2018, while people visiting friends and relatives spent on average $2,400. Thus, we can see a notable gulf between visitor markets. People visiting friends and relatives tend to spend less when they visit, especially on accommodation, as they often have friends or family to stay with. They also tend to stay for shorter periods and are more likely to be Australians, or New Zealanders residing in Australia.
Regional tourism spend over the year remained solid, with all but two regions experiencing growth in the 2018 calendar year, according to the latest Monthly Regional Tourism Estimates.
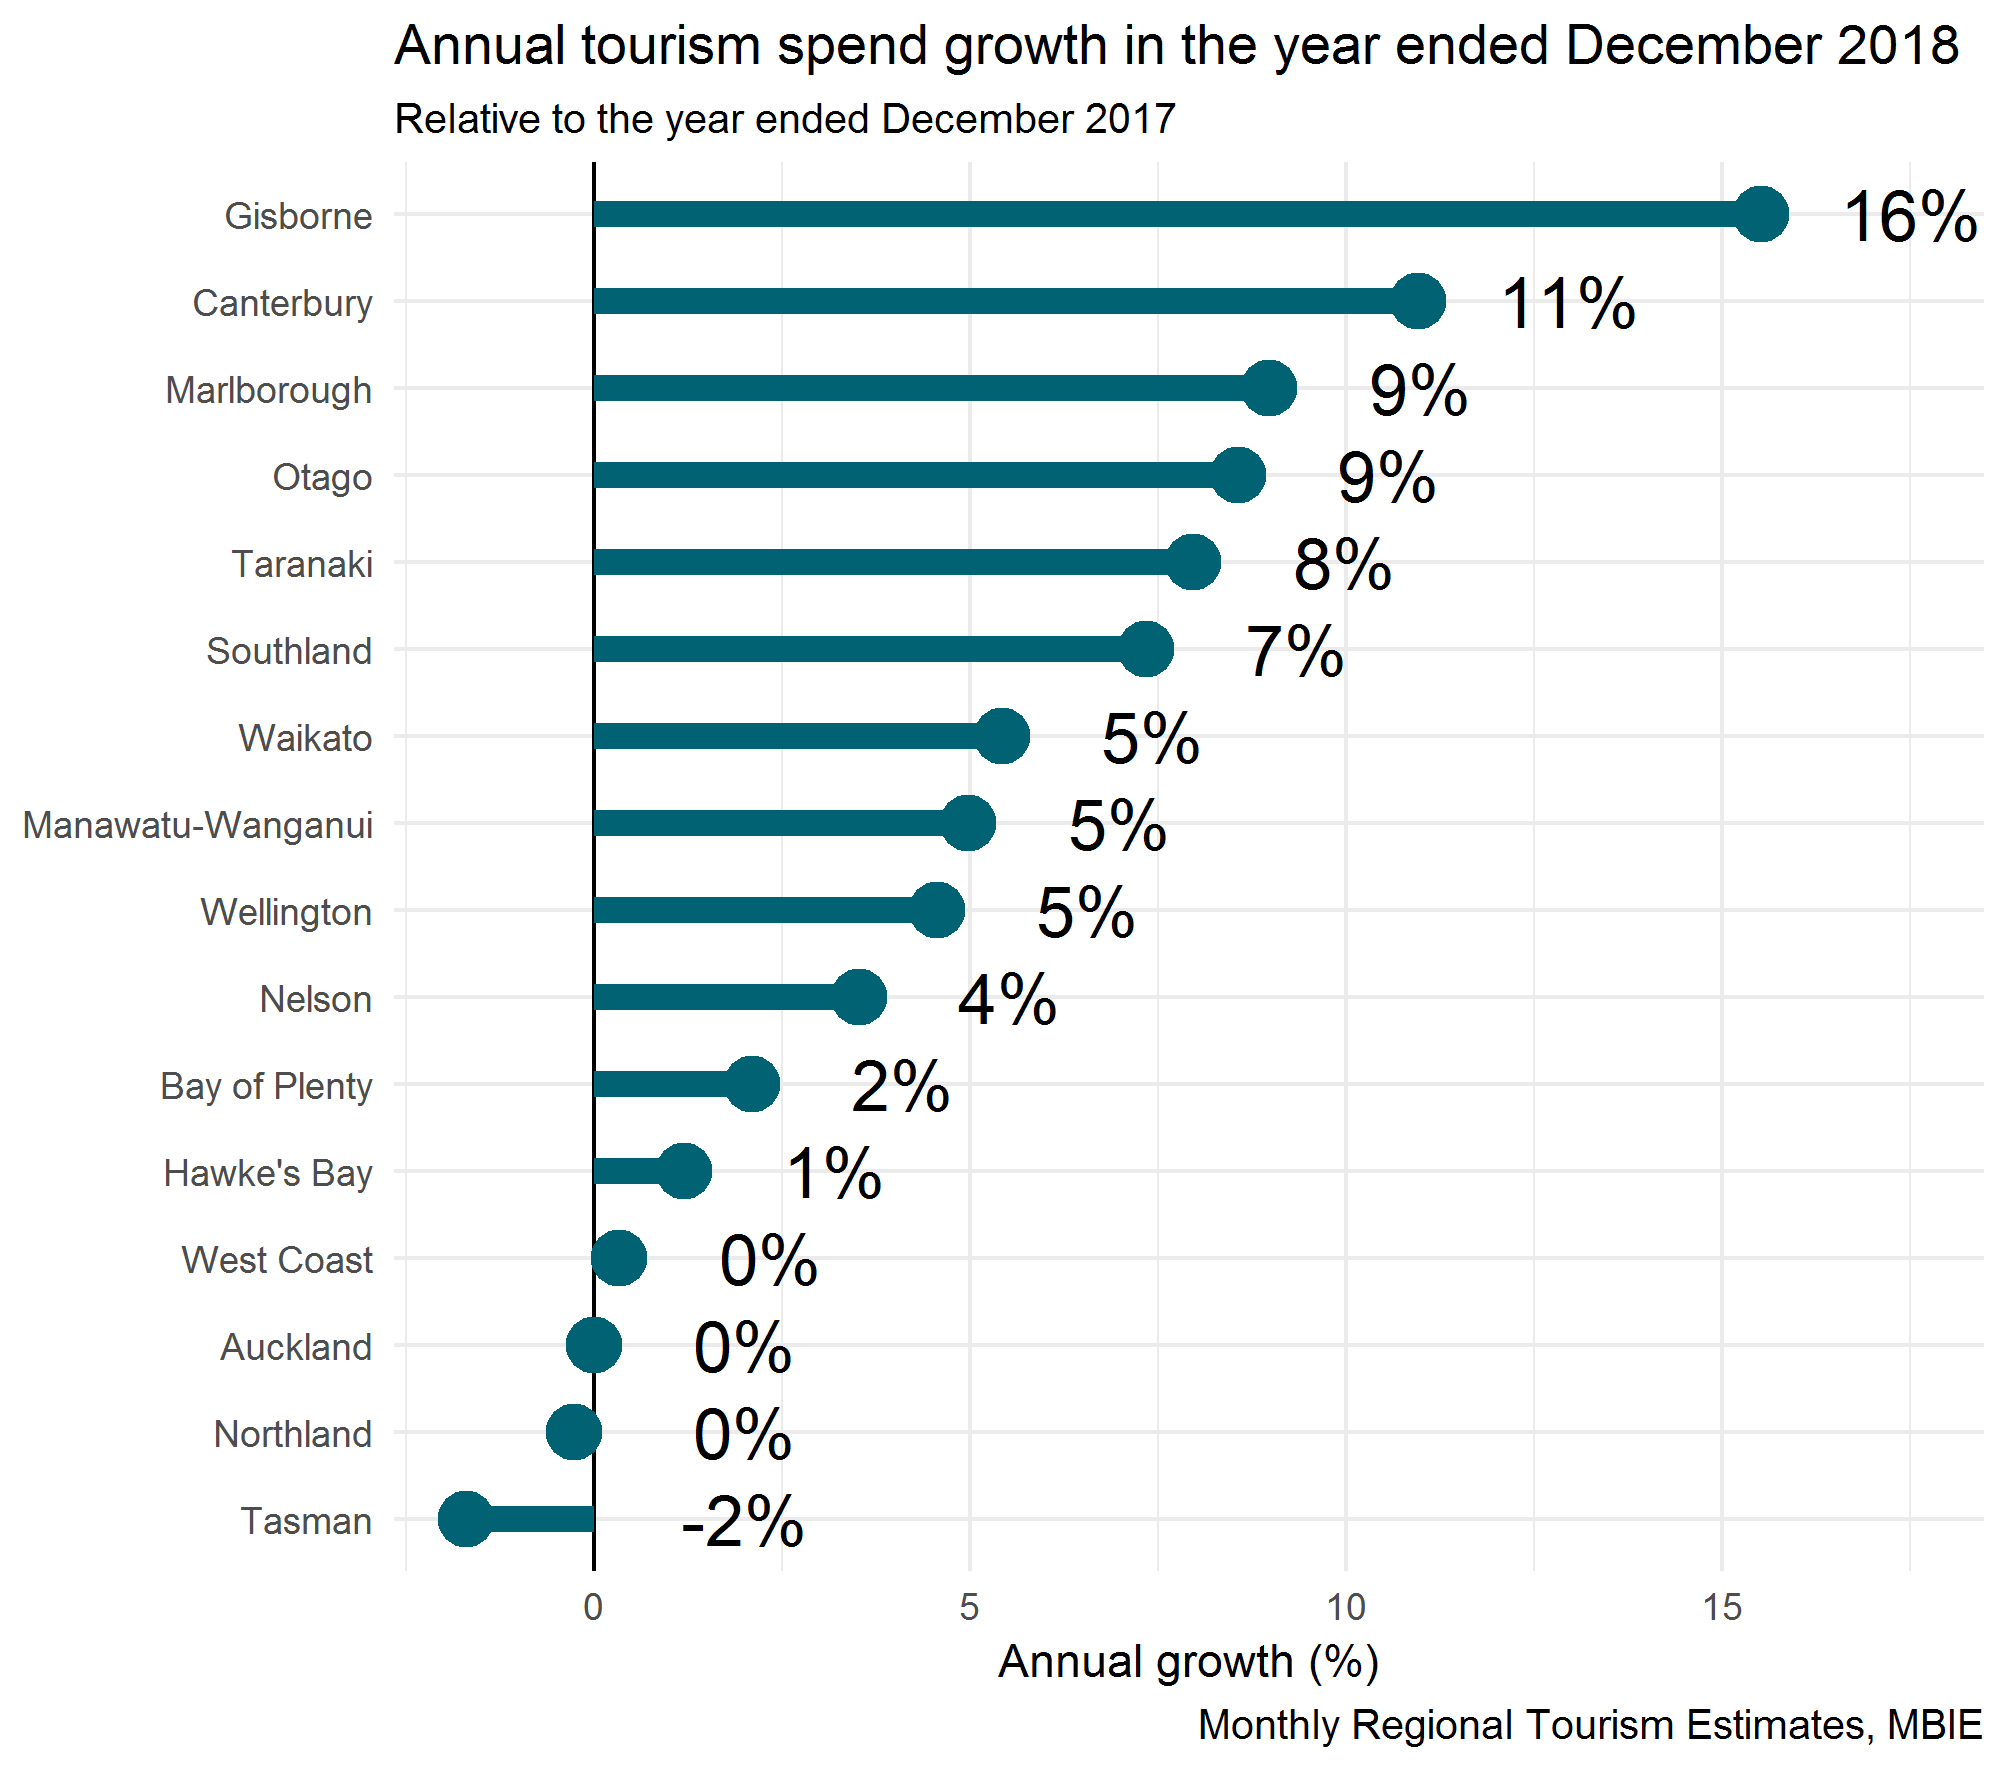
Auckland, which makes up a very large proportion of overall tourism spend in New Zealand (29%) has shown no growth over the year, while West Coast, historically one of the big movers in tourism over the last year is showing very little over 2018.
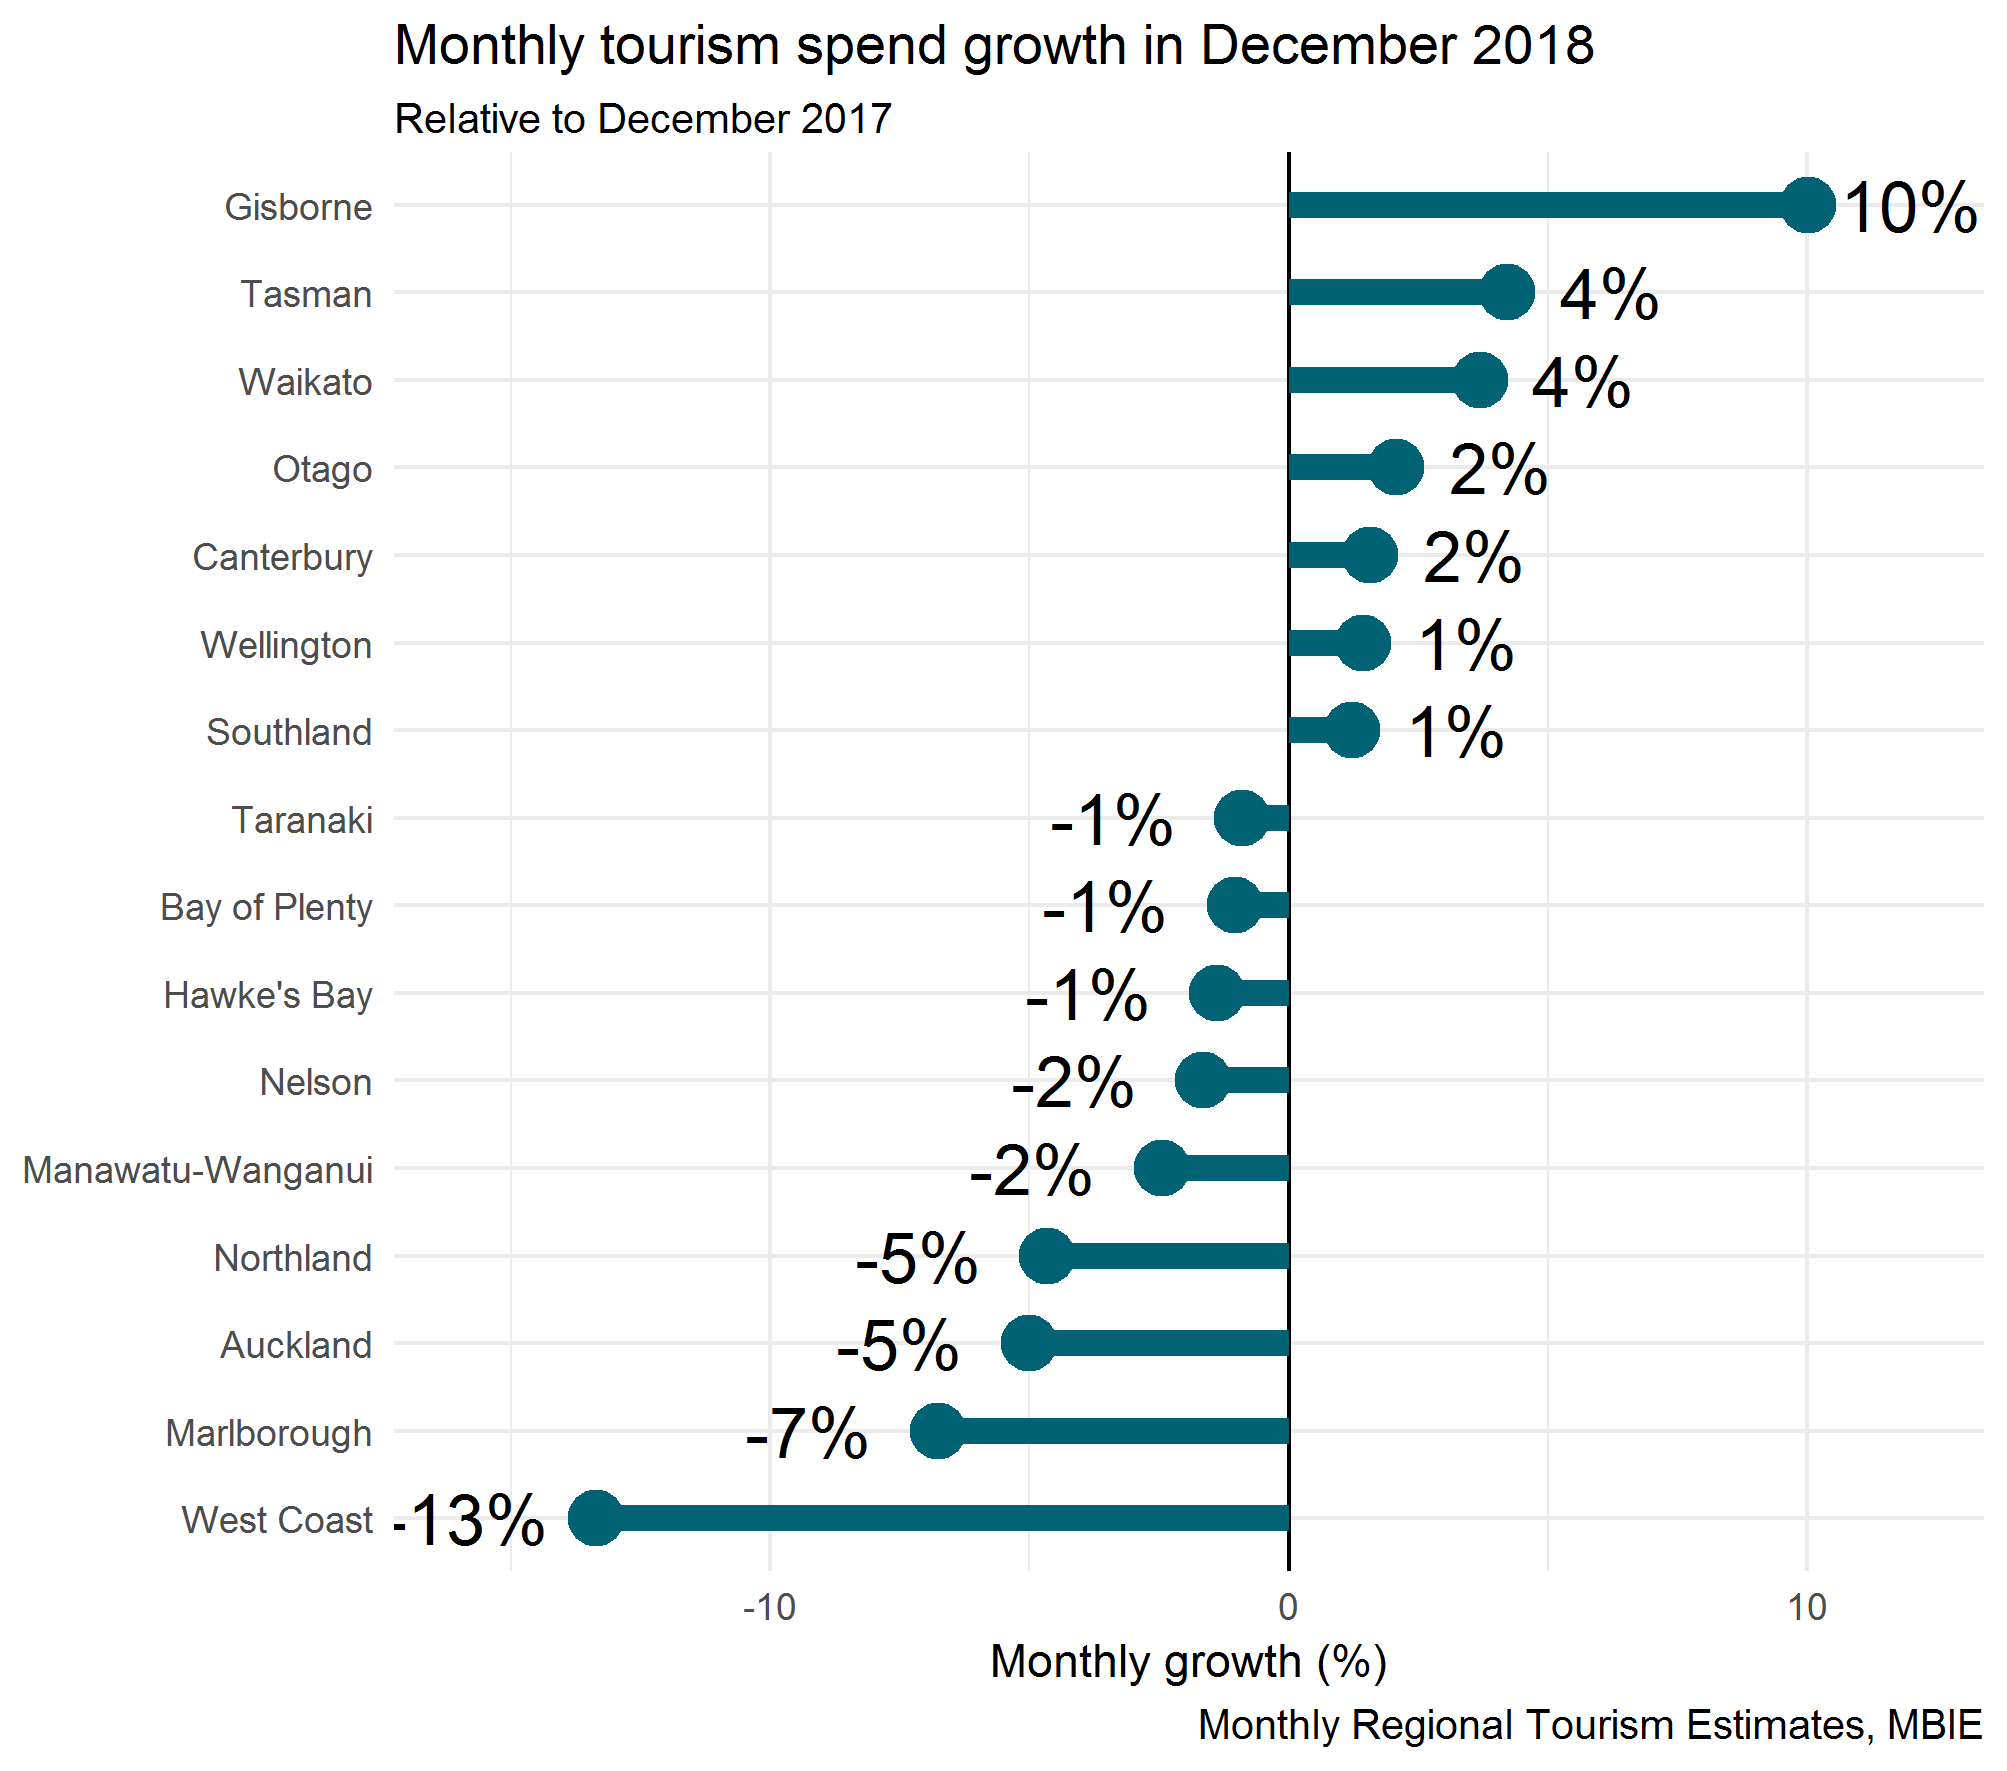
These weaker growth patterns are driven by a much poorer-than-average December, and this is largely across the board with nine of 16 regions showing falls compared with the month of December in the previous year- with West Coast showing the largest fall.
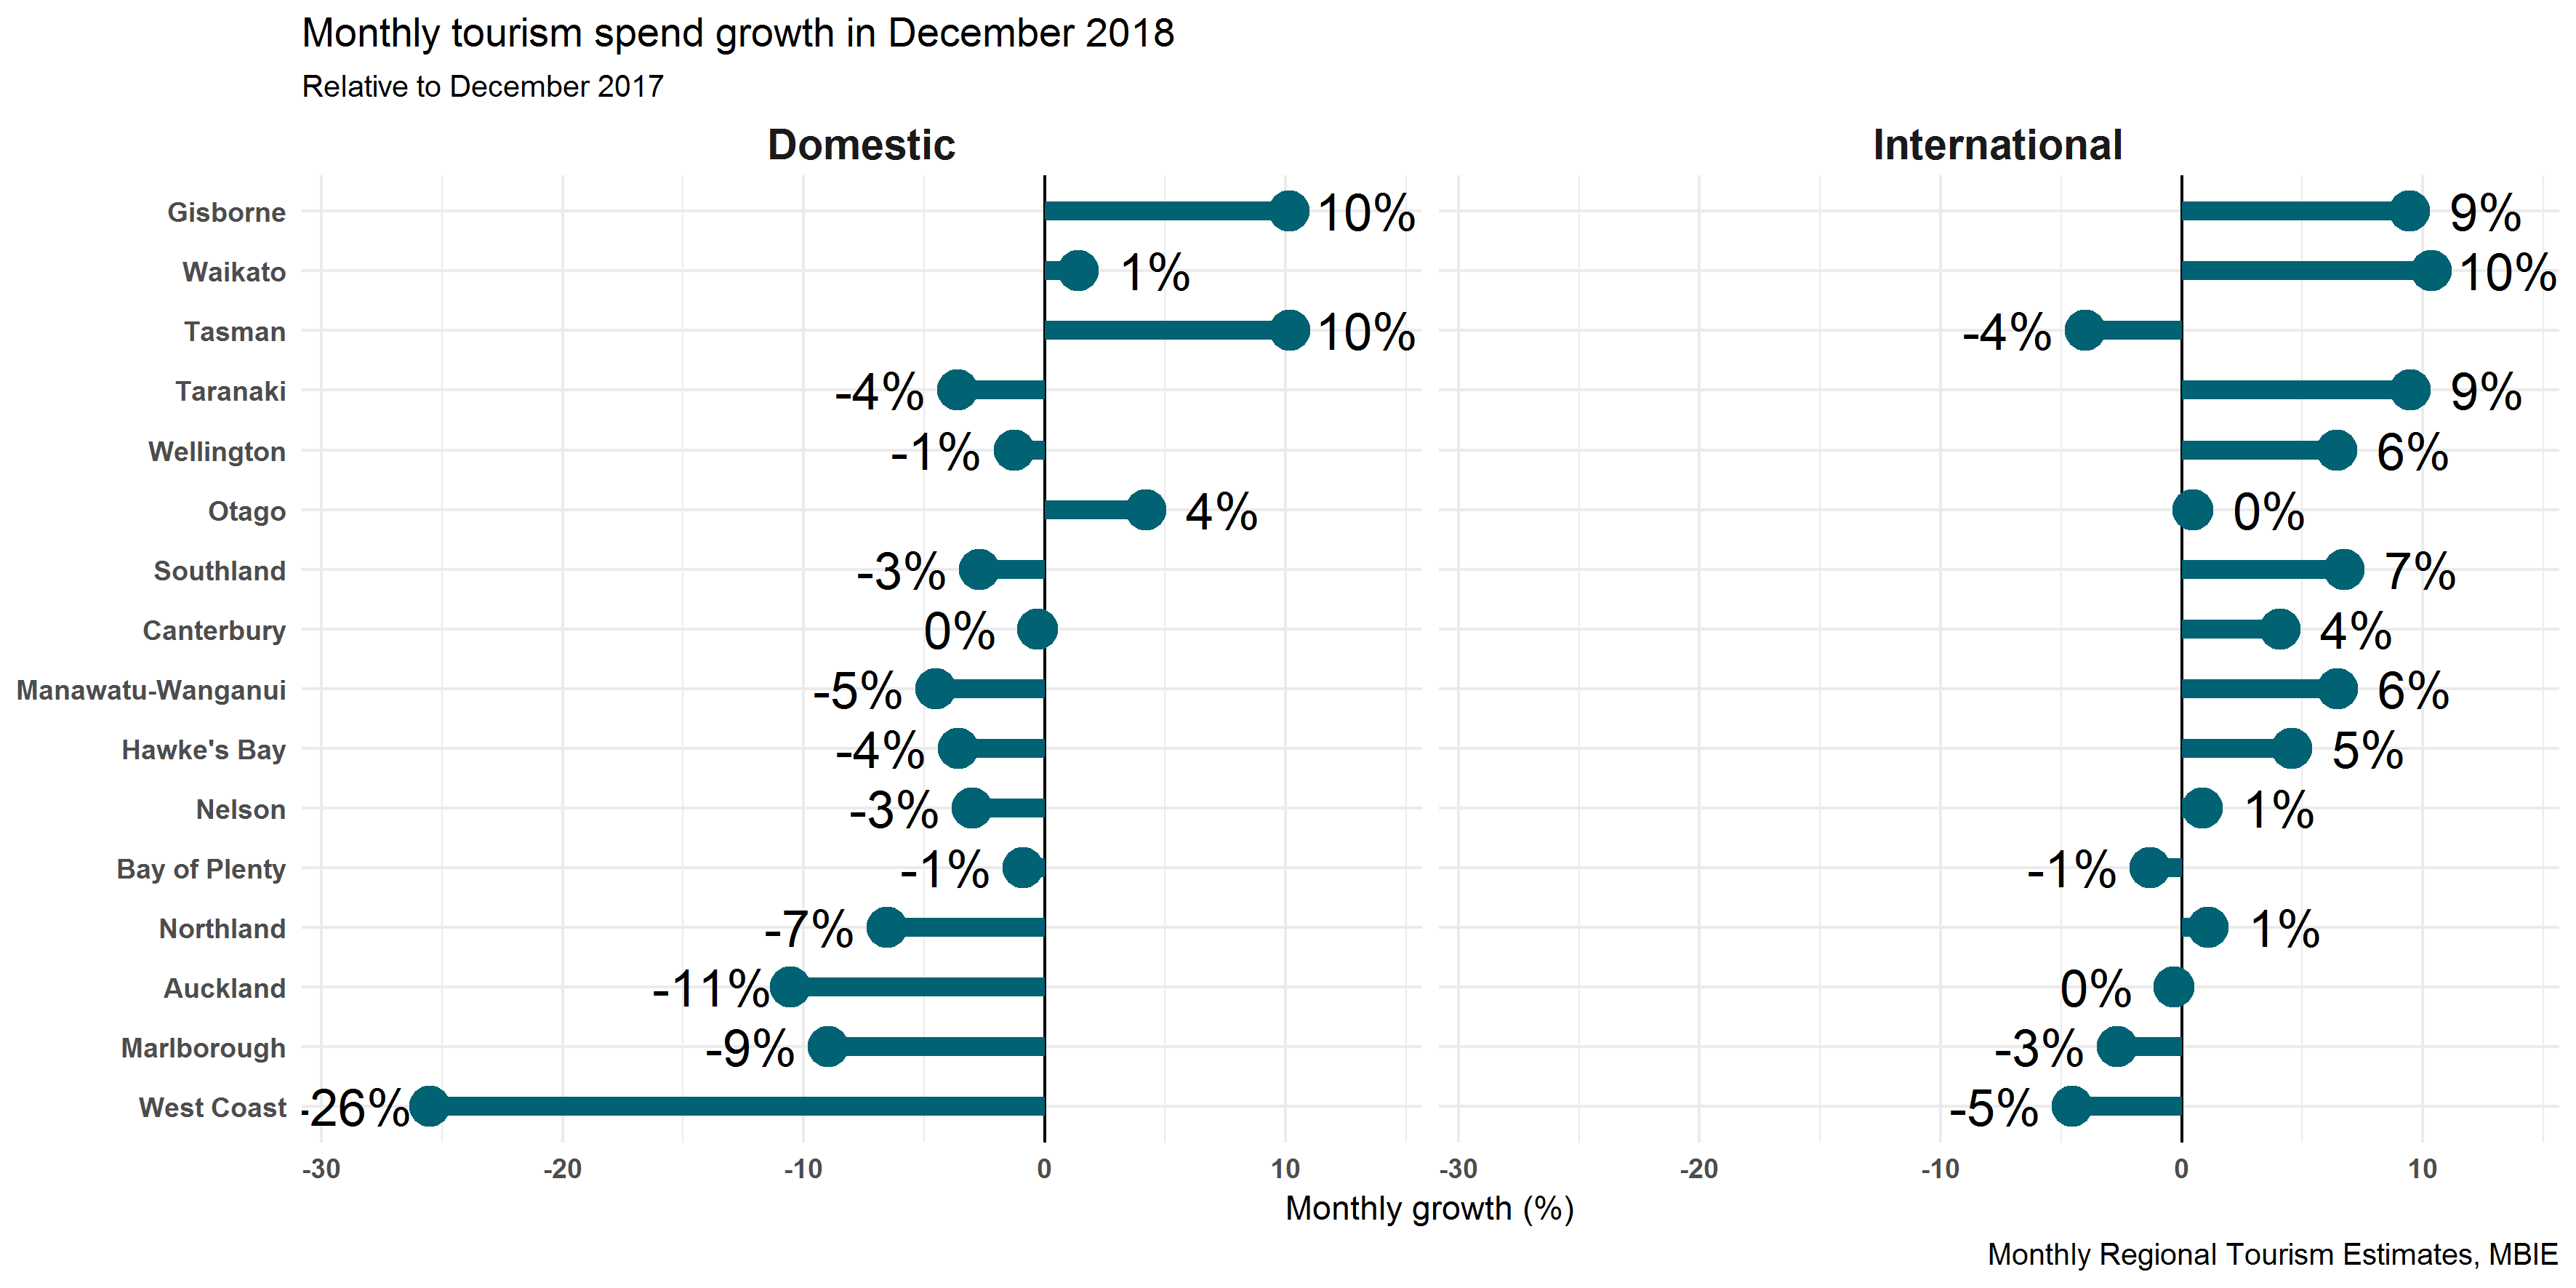
Lower domestic tourism spending appears to be driving the fall in growth. Overall, 11 of 16 regions were down compared with the same month a year ago, and the West Coast was particularly affected with a 26 per cent fall in domestic expenditure for December.
You can explore expenditure in the regions using the MRTE insights viewer.
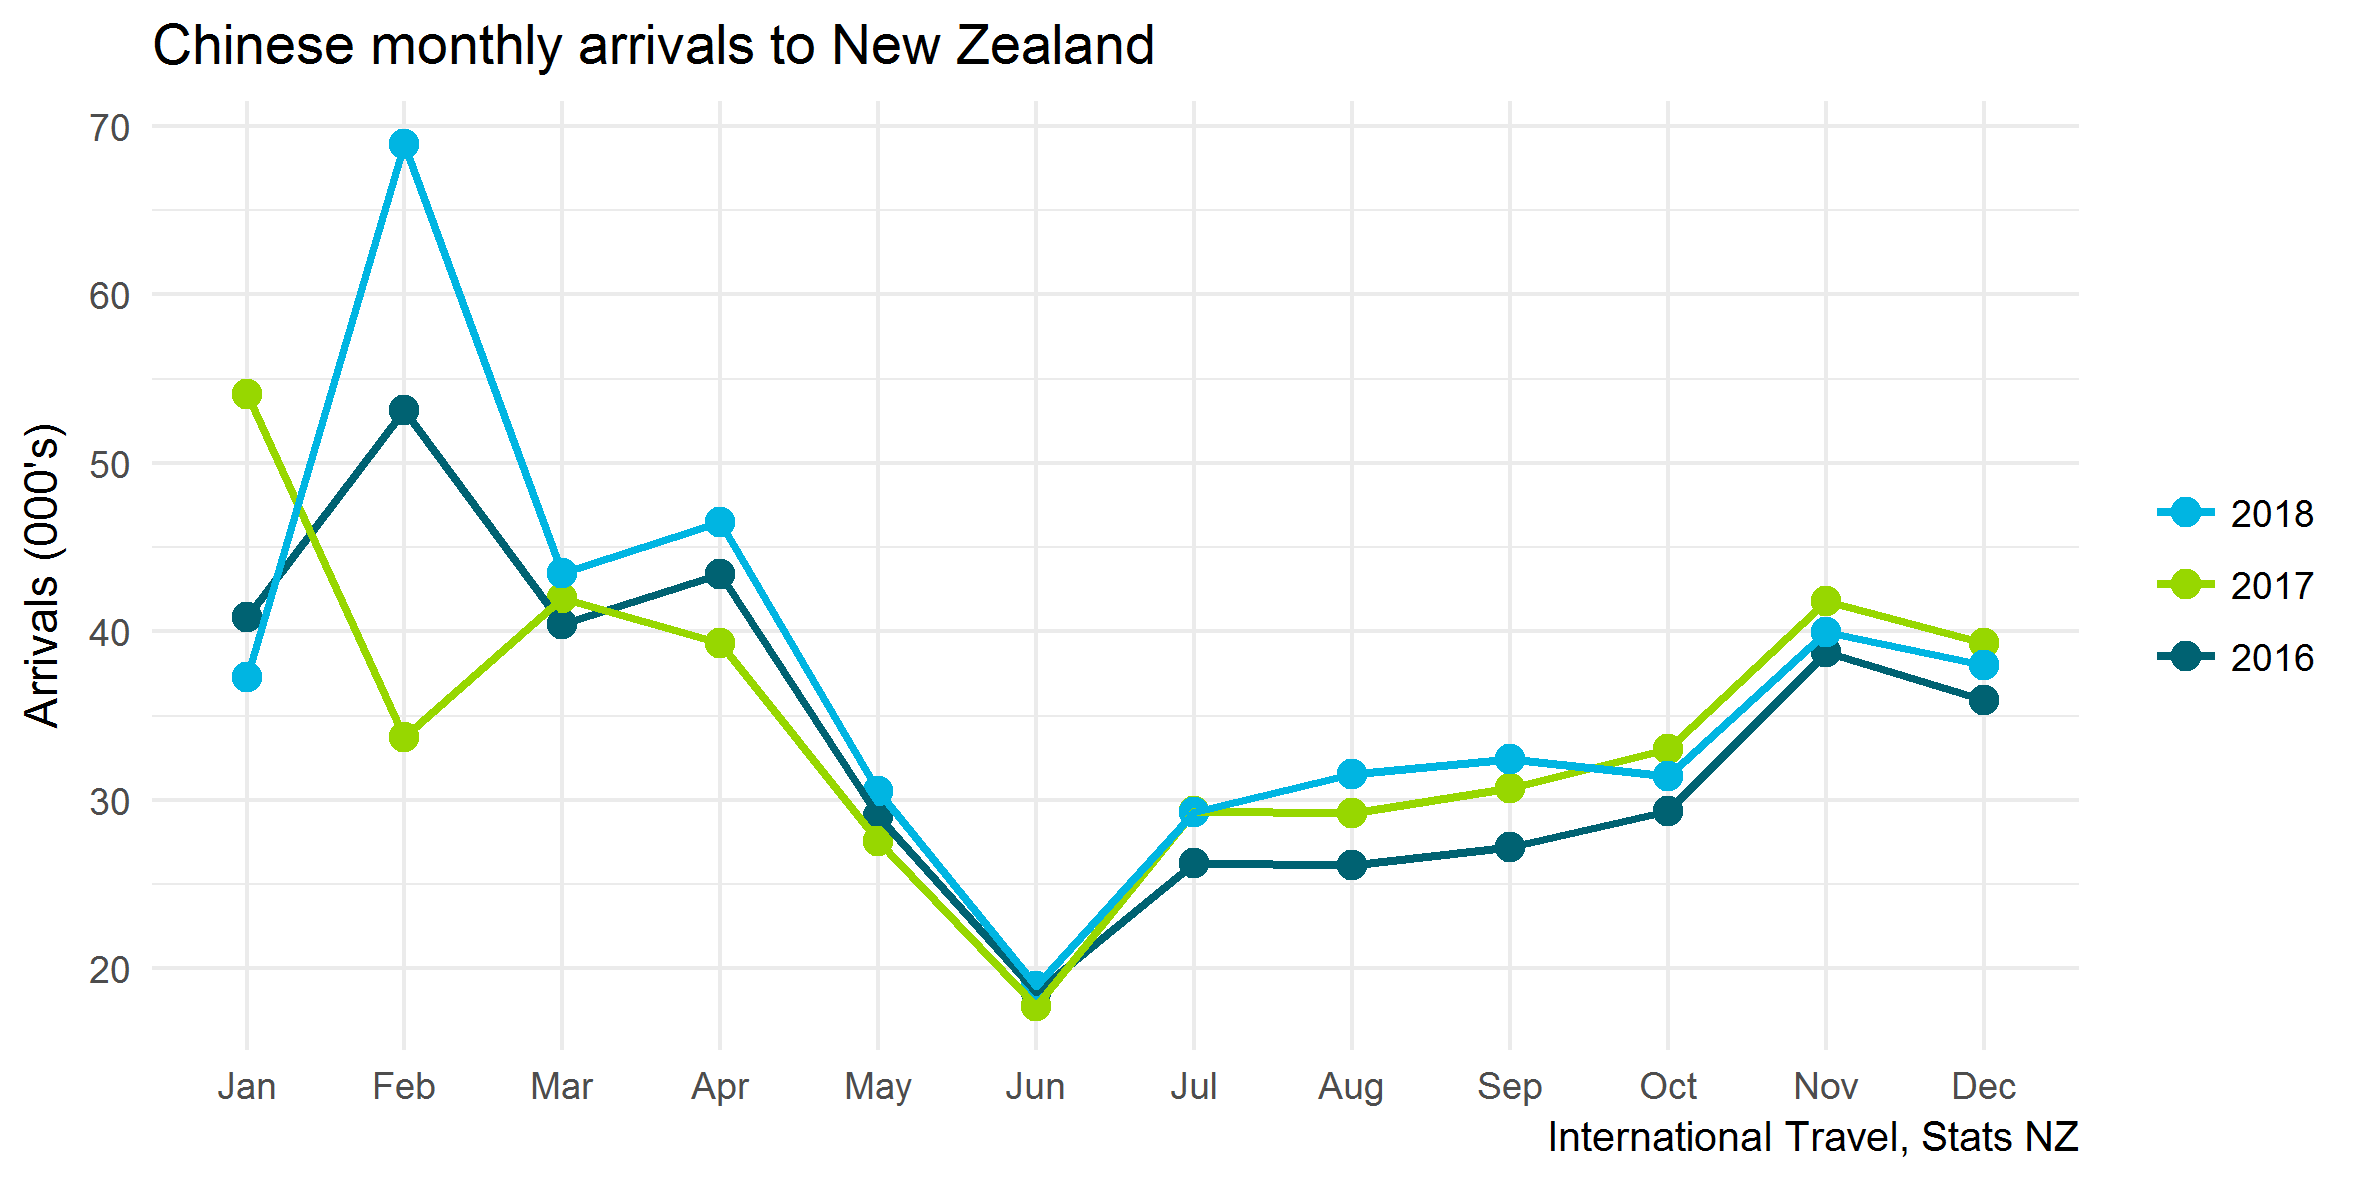
There has been a lot of discussion about the impact of Chinese New Year this year, amid concerns around lower Chinese visitor numbers. While there were fewer Chinese arrivals over October, November and December 2018 when compared to 2017 these numbers were higher when compared to 2016.
Despite the falls in recent months, we are still seeing fairly solid growth in Chinese visitor spend over the year. The IVS showed Chinese spending rose 14 per cent in the year ended December 2018 (though not statistically significant), reaching $1.68b.
The latest provisional visitor arrival statistics show that visitor numbers are similar to previous years.
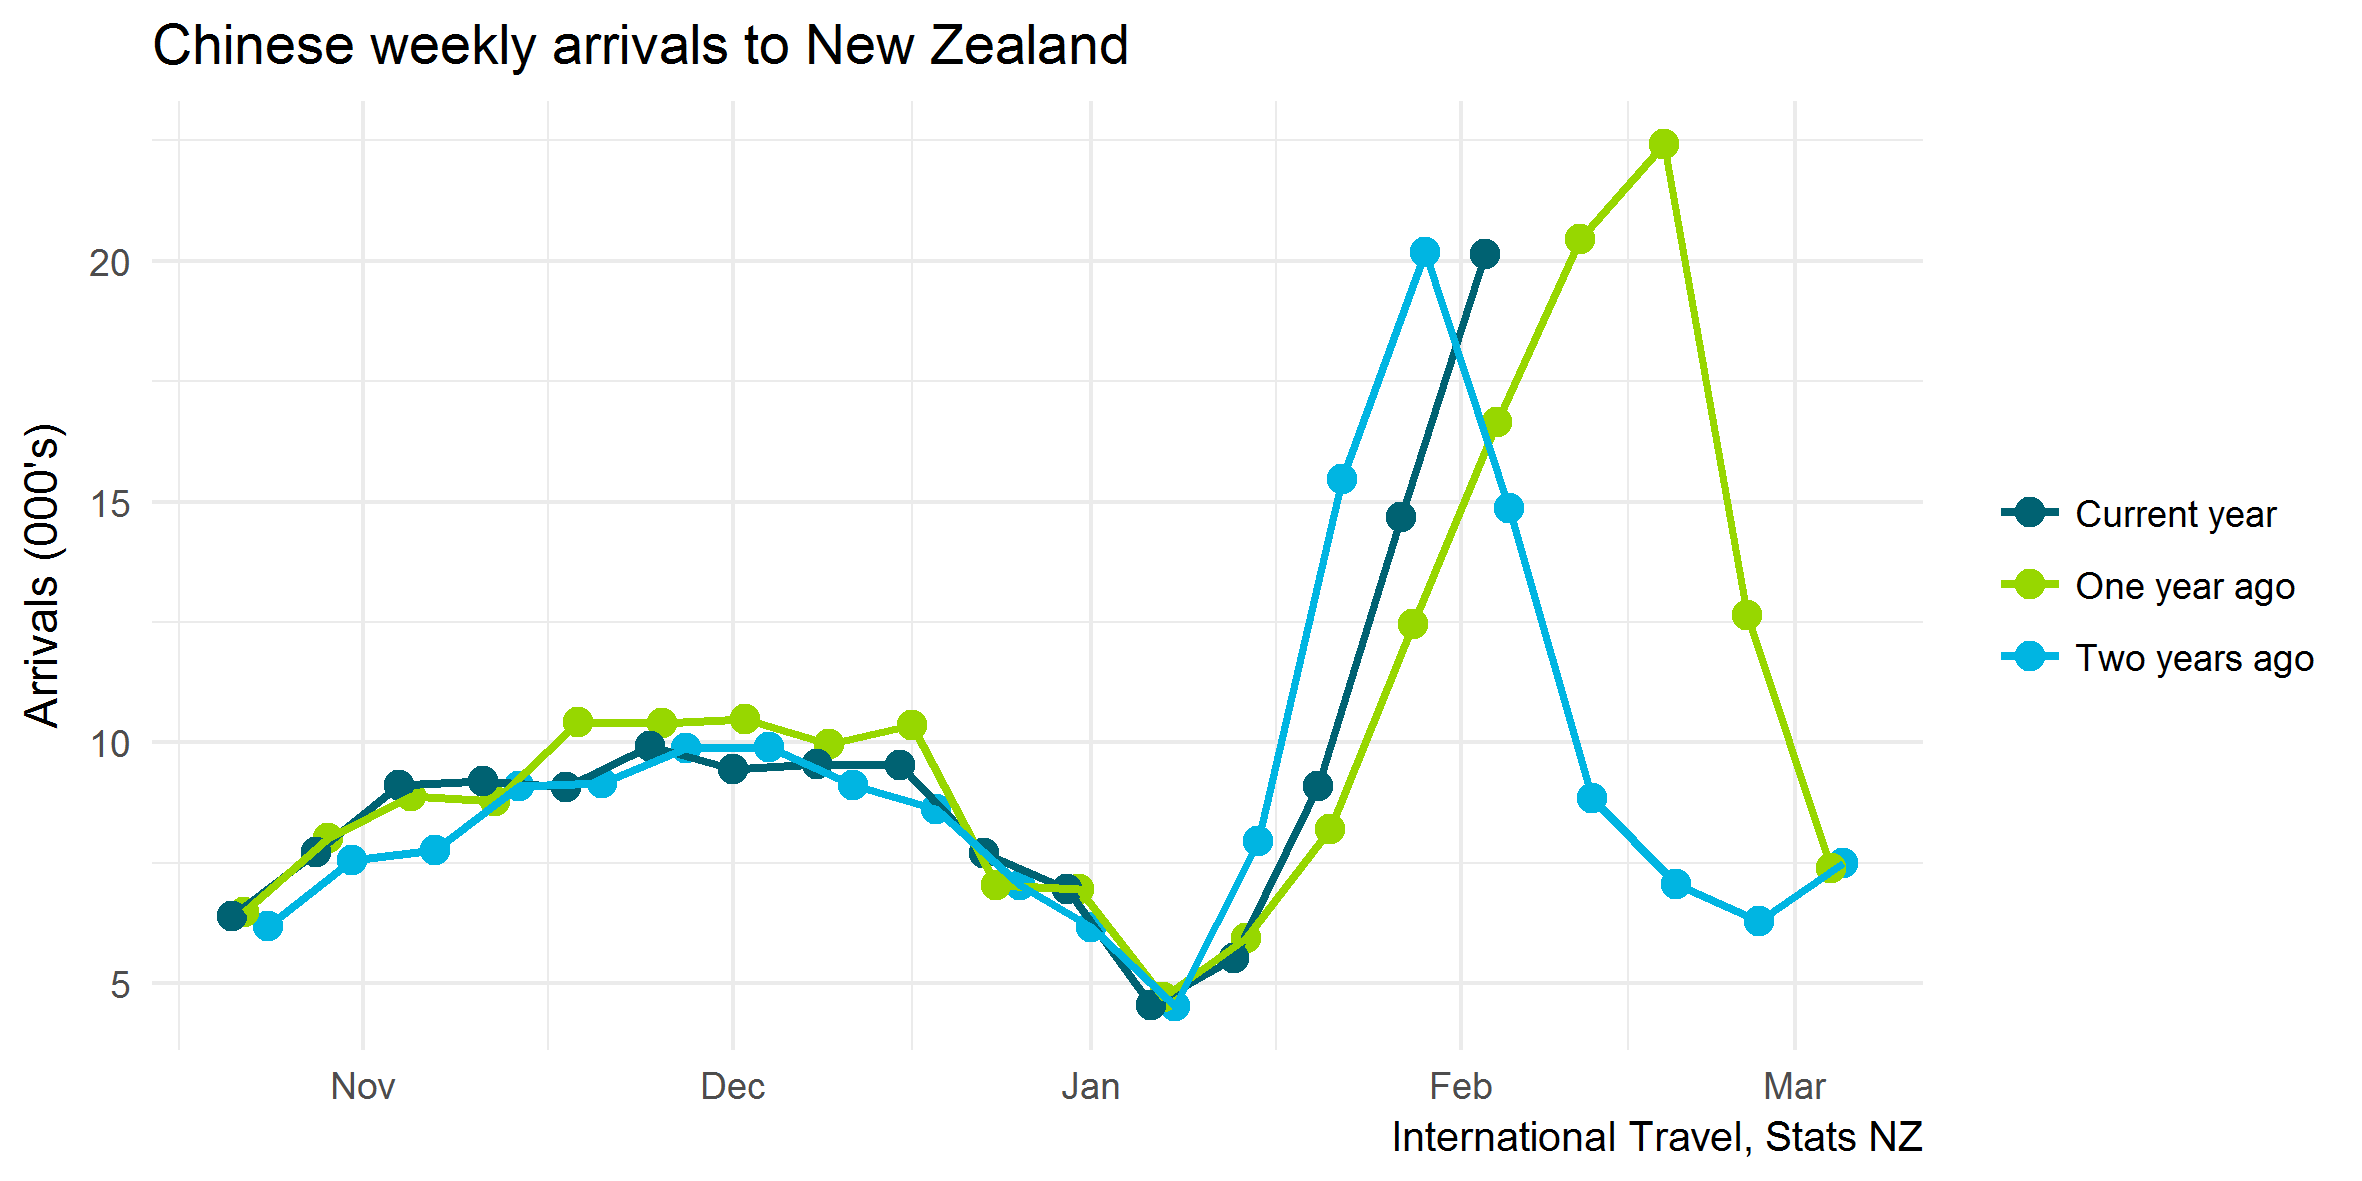
However, because the period of Chinese New Year shifts every year, it’s often difficult to understand whether the season is higher or lower than previous seasons. Chinese New Year fell in the week ending 10 February this year, compared with 18 February in 2018 and 29 January in 2017. So the expectation would be an earlier build-up of Chinese arrivals this year, by around a week – if we are to see similar patterns to previous years.
If we normalise the data, by expressing it in days to Chinese New Year, then a pattern can be identified. The graph below suggests that, given current data, Chinese New Year 2019 visitor numbers are behind what was seen last year, but could be considered similar or slightly better than two years ago.
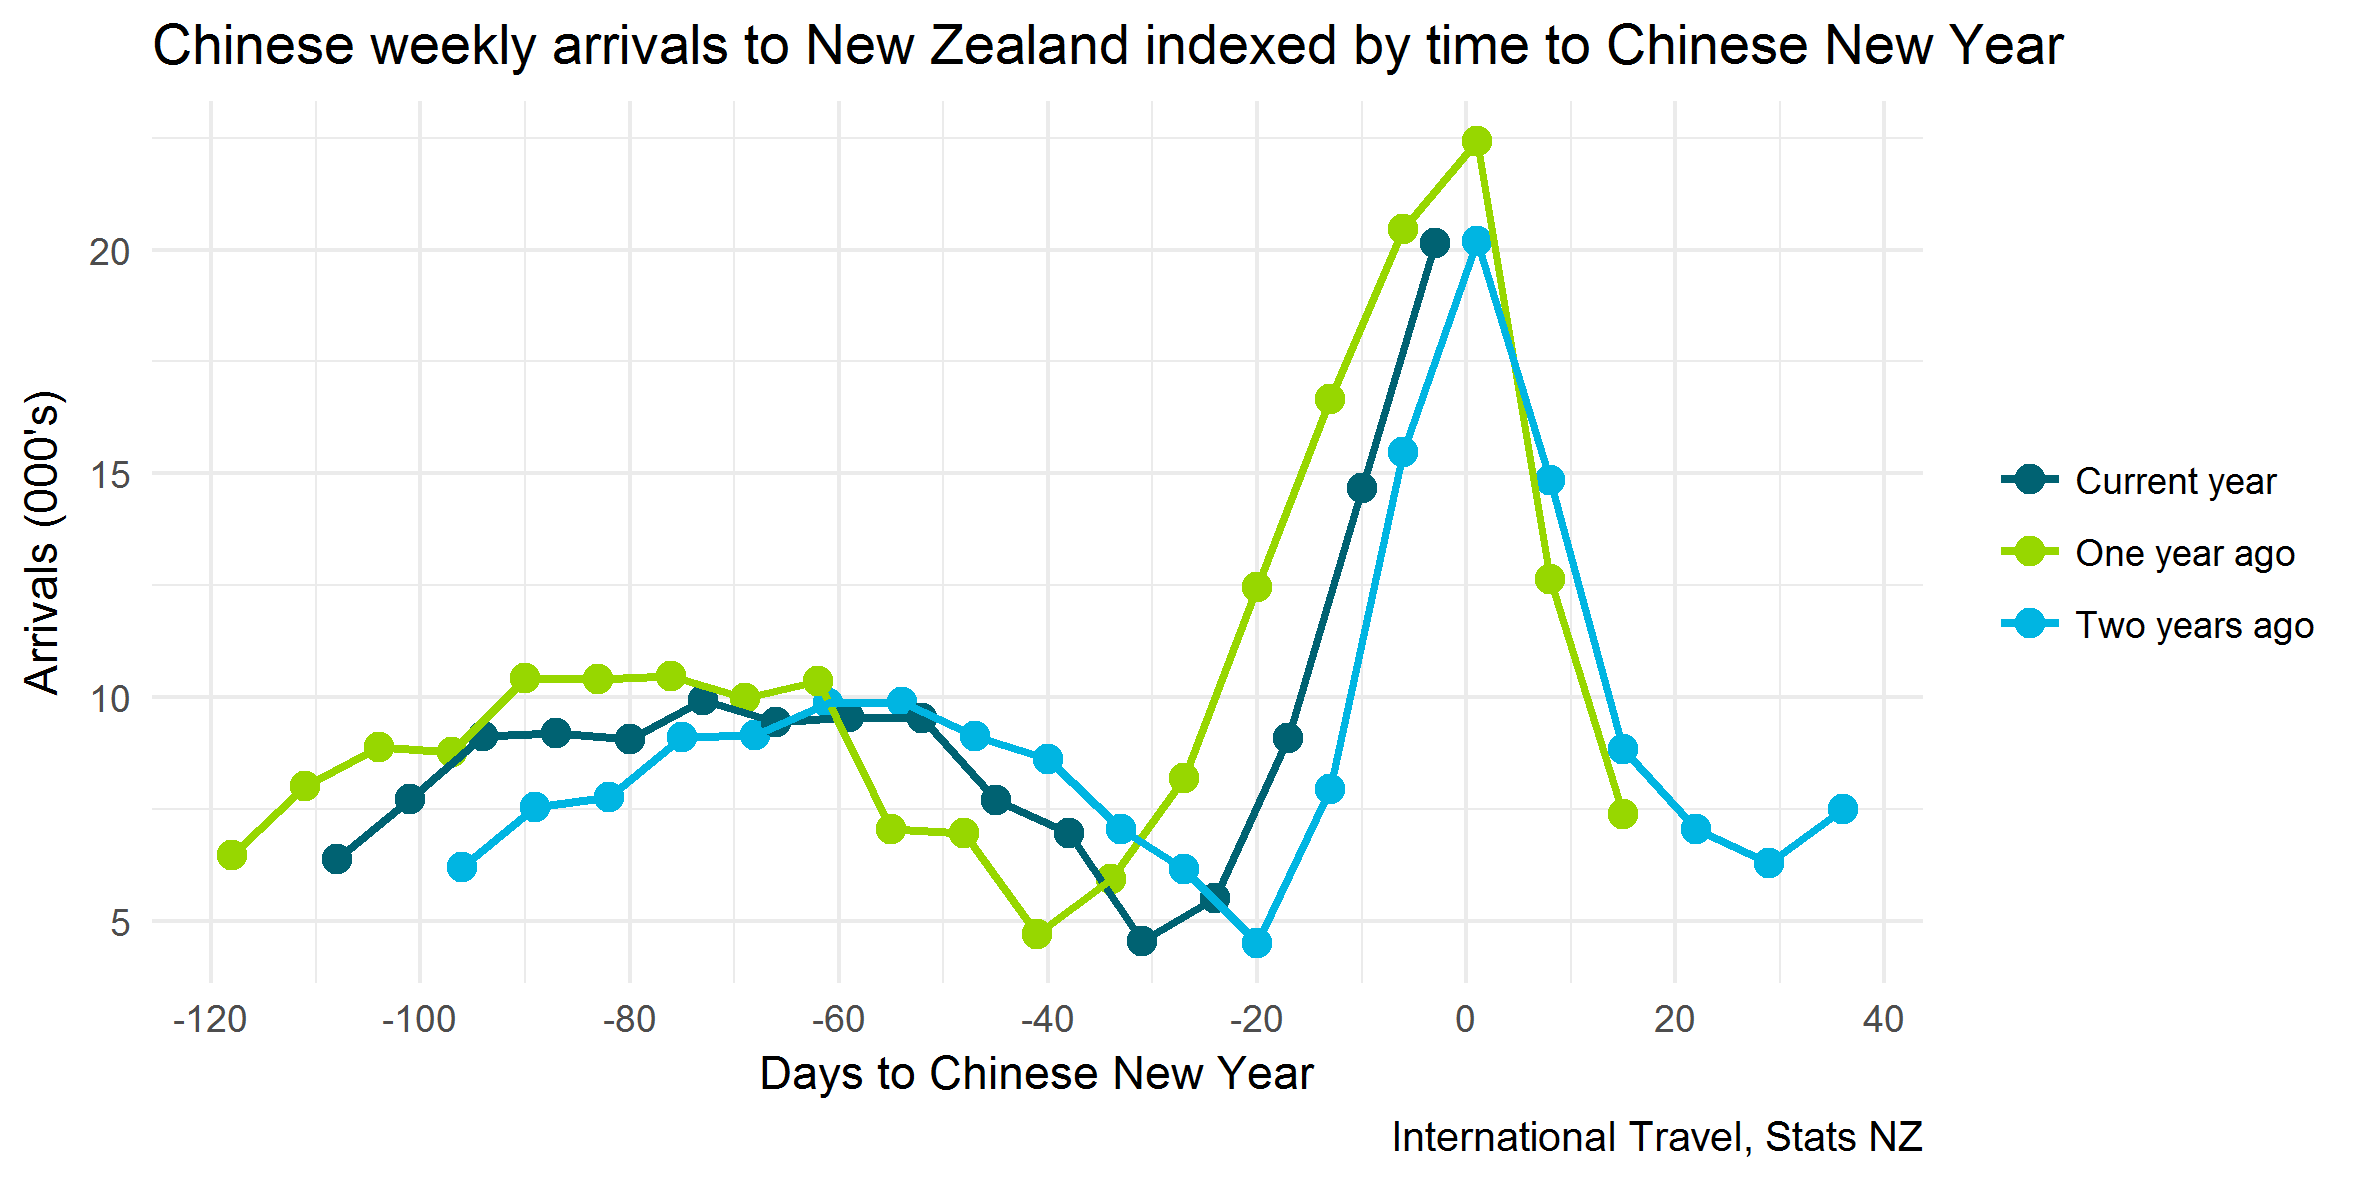
Given the current anecdotal evidence of fewer Chinese visitors, it seems unlikely that we’ll meet the level of last year, but it’s certainly possible at this moment that we could do as well as the 2017 season.